
Deep Learning for Public Safety

This article first appeared on KDnuggets
Contributors: Alex Tellez, Michal Malohlava, Prithvi Prabhu, Hank Roark, Amy Wang.
Download full report
We’ve seen some incredible applications of Deep Learning with respect to image recognition and machine translation but this particular use case has to do with public safety; in particular, how Deep Learning can be used to fight crime in the forward-thinking cities of San Francisco and Chicago. The cool thing about these two cities (and many others!) is that they are both open data cities, which means anybody can access city data ranging from transportation information to building maintenance records. So, if you are a data scientist or thinking about becoming a data scientist, there are publicly available city-specific datasets you can play with. For this example, we looked at the historical crime data from both Chicago and San Francisco and joined this data with other external data, such as weather and socioeconomic factors, using Spark’s SQL context.

Figure 1: Spark + H2O Workflow
We do the data import, ad-hoc data munging (parsing the date column, for example), and joining of tables by leveraging the power of Spark and then publish the Spark RDD as an H2O Frame (Fig. 1 ).
Figures 2 and 3 below include some cool visualizations we made of the joined table provided by the Flow framework as part of our latest H2O product, which you can download here .

Figure 2: San Francisco crime visualizations
Figure 3: Chicago crime visualizations
Interesting how in BOTH cities crime seems to occur most frequently during the winter – a surprising fact given how cold the weather gets in Chicago!
Using H2O Flow, we were able to look at the arrest rates of every category of recorded crimes in Chicago versus the percentage of total crimes each category represents. Some crimes with the highest arrest rates also occur least frequently, and vice versa.

Figure 4: Chicago arrest rates and total % of all crimes by category

######Figure 5: Creating the custom graph in H2O Flow
Once the data is transformed to an H2O RDD, we train a Deep Neural Network to predict whether or not for a given crime if an arrest is more / less likely to be made. Here are some fun screenshots of our H2O Deep Learning model being tuned inside of Flow and the resulting AUC curve from scoring the trained model against the validation dataset.


| Figure 6: San Francisco validation data AUC | Figure 7: Chicago validation data AUC |
|---|
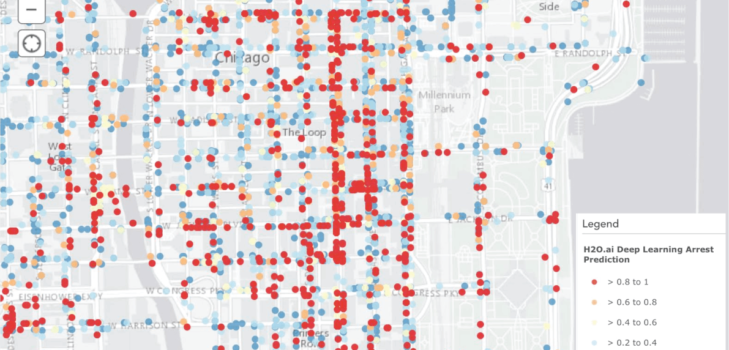
Figure 8: Geo-mapped predictions
Because each of the crimes reported comes with latitude-longitude coordinates, we scored our hold out data using the trained model and plotted the predictions on a map of Chicago – specifically, the Downtown district. The color coding corresponds to the model’s prediction for likelihood of an arrest with red being very likely (X > 0.8) and blue being unlikely (X < 0.2). Smart analytics + resource management = safer streets.