

Introduction
On May 25th, 2005, the UEFA Champions League final between AC Milan and Liverpool was held at the Atatürk Olympic Stadium in Istanbul. The match is still considered one of the greatest finals in football history. AC Milan took a 3-0 lead in the first half but Liverpool made a miraculous comeback in the second half to tie the game. Thanks to all the saves by Liverpool’s goalkeeper Jerzy Dudek during the penalty shootout, Liverpool won their 5th European Cup. As a result, this classic match is now commonly known as the Miracle of Istanbul.
You may wonder how Liverpool forced a comeback after conceding three goals in the first half. Let’s look at the game again from a data scientist’s perspective. In this article, we will analyze the shots, pressure as well as players’ position using open data from StatsBomb. Without further ado, let’s get started!
The Match’s First Half
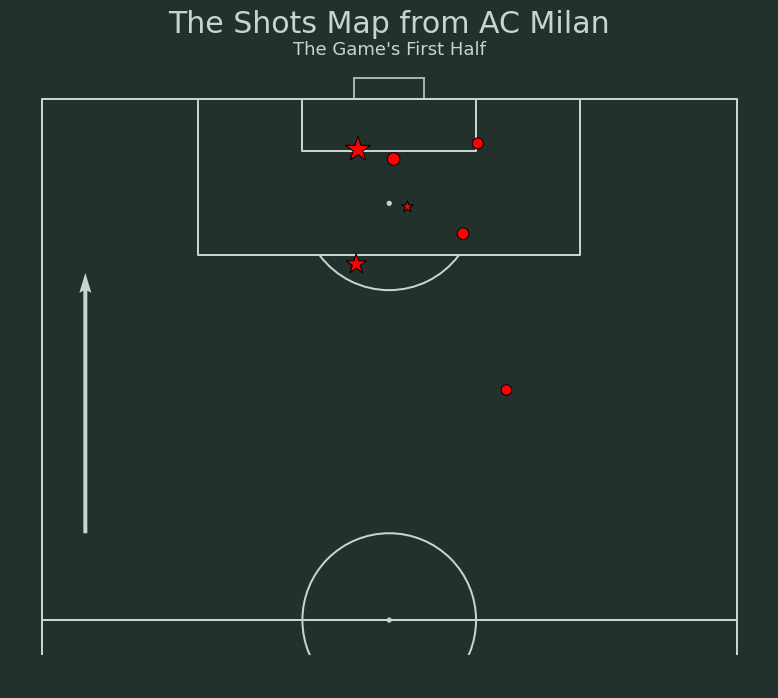
AC Milan scored three goals in the first half. And if you see from the shot map below, most of the AC Milan happened inside the penalty area.
AC Milan’s Shots Map (Circles = Shots, Stars = Goals)
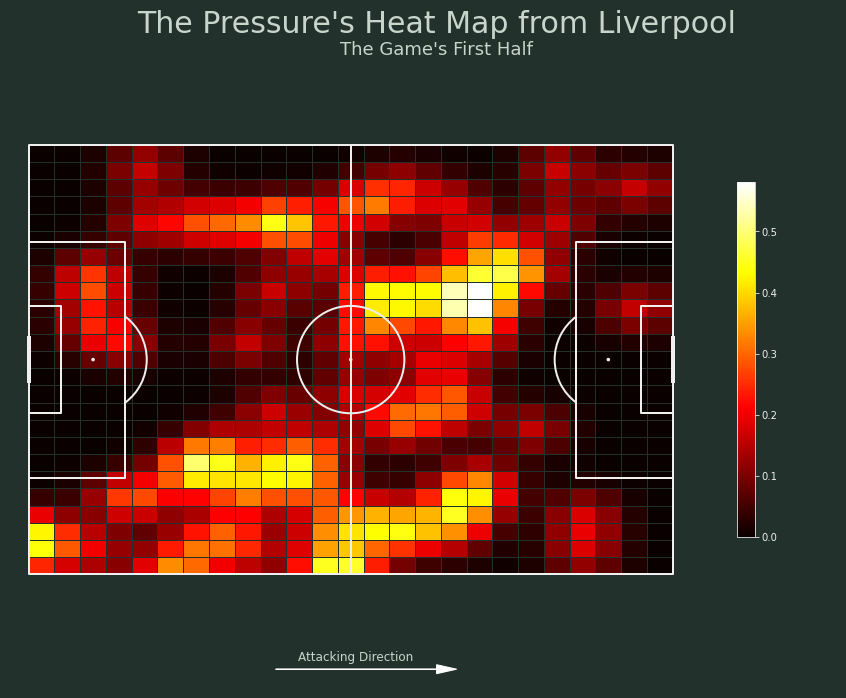
You can also see from the pressure heat map below that AC Milan didn’t get much pressure in their own half. The left side of the field is mostly dark meaning Liverpool’s attacks didn’t cause AC Milan too many troubles.
AC Milan’s Pressure from Liverpool (AC Milan Attacking from Left to Right)
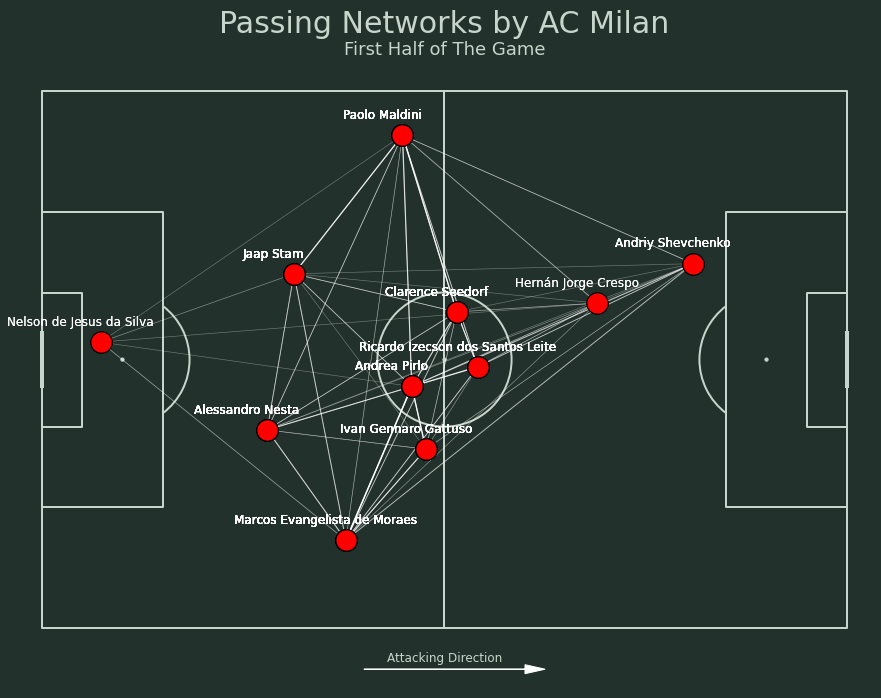
And if you see from the passing networks below, AC Milan played an offensive game. The average position of AC Milan’s two forwards (Andriy Shevchenko and Hernán Crespo) is pretty close to Liverpool’s penalty box. Also, we can see that the networks are not centralized. Most of the passes were made between the midfielders and fullbacks.
AC Milan’s Passing Network (AC Milan Attacking from Left to Right)
On the other hand, Liverpool struggled to convert their shots into goals. What happened?
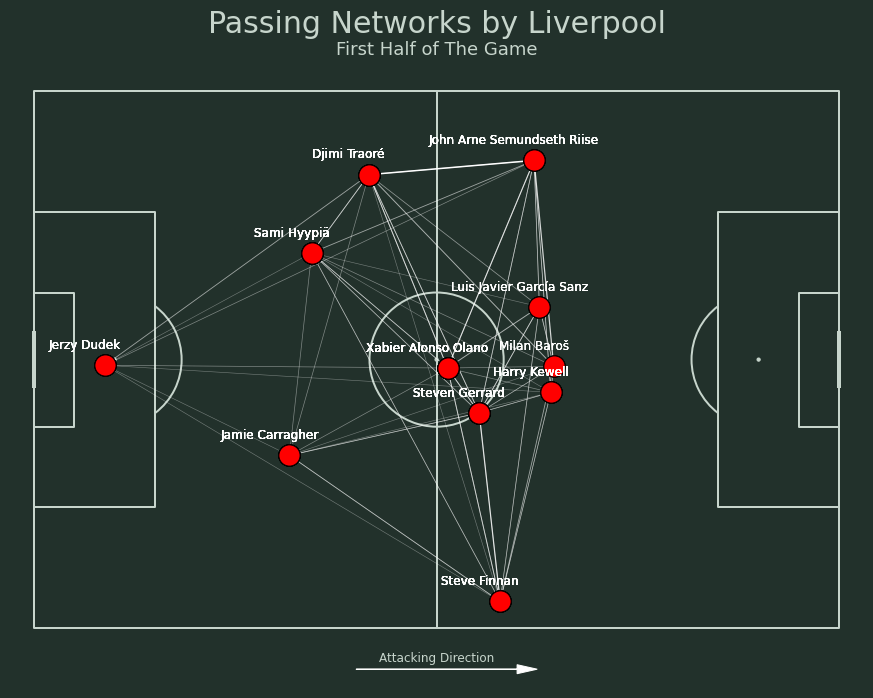
First, let’s look at their passing networks below. The average positions of Liverpool’s players weren’t closer to AC Milan’s penalty box. There were very few passes between the two centre-backs (Sami Hyypia and Jamie Carragher) indicating a weak partnership. On top of that, Liverpool’s right back (Steve Finnan) was seen in a more aggressive attacking position than the other three Liverpool defenders. That also left Liverpool vulnerable during AC Milan’s counter-attack.
Liverpool’s Passing Network (Liverpool Attacking from Left to Right)
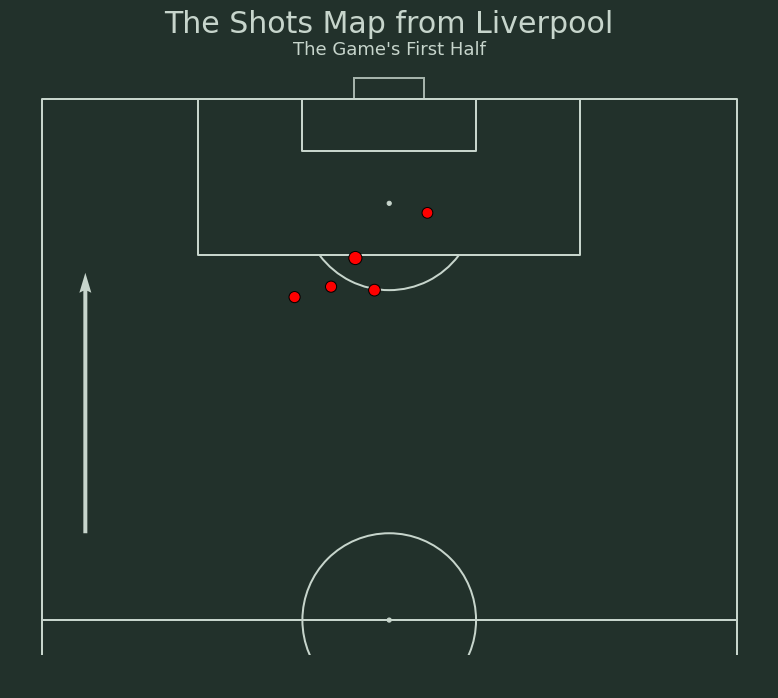
So what could Liverpool do in the second half? Let’s take a look at Liverpool’s shots map below. You can see that Liverpool had a few shots from the left side but failed to convert any into a goal. Therefore, Liverpool had to try something different and attack from the other side.
Liverpool’s Shots Map (Circles = Shots)
The Match’s Second Half aka The Miraculous Comeback
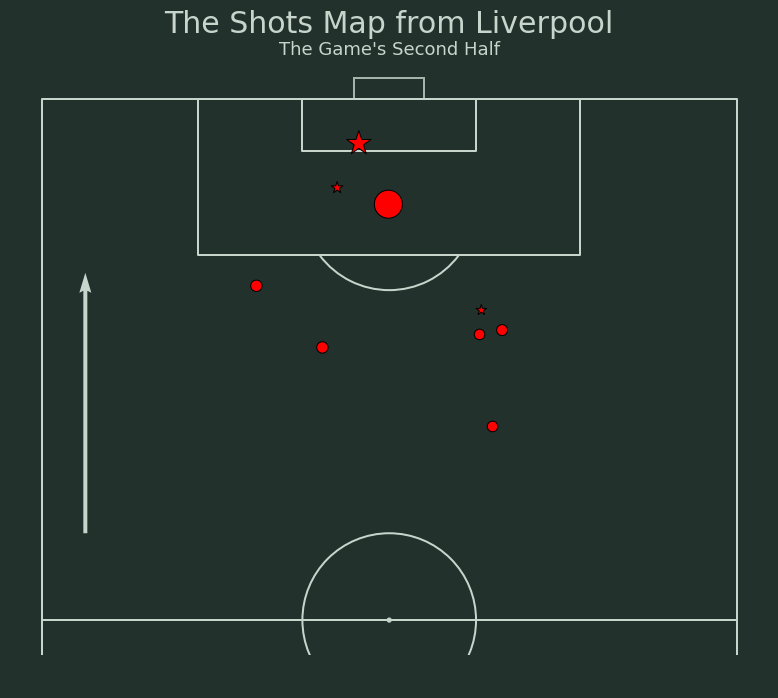
Liverpool had to score at least three goals against a solid AC Milan team in the second half. In other words, Liverpool needed a miracle. They needed to try something different and they did exactly that. As you can see from the shot maps below, Liverpool took more shots from the right side when compared to their shots in the first half. They also took those shots from the left side of AC Milan’s penalty box. As a result, they got the three goals they badly needed and football fans around the world witnessed one of the very best comebacks in football history.
Liverpool’s Shots Map (Circles = Shots, Stars = Goals)
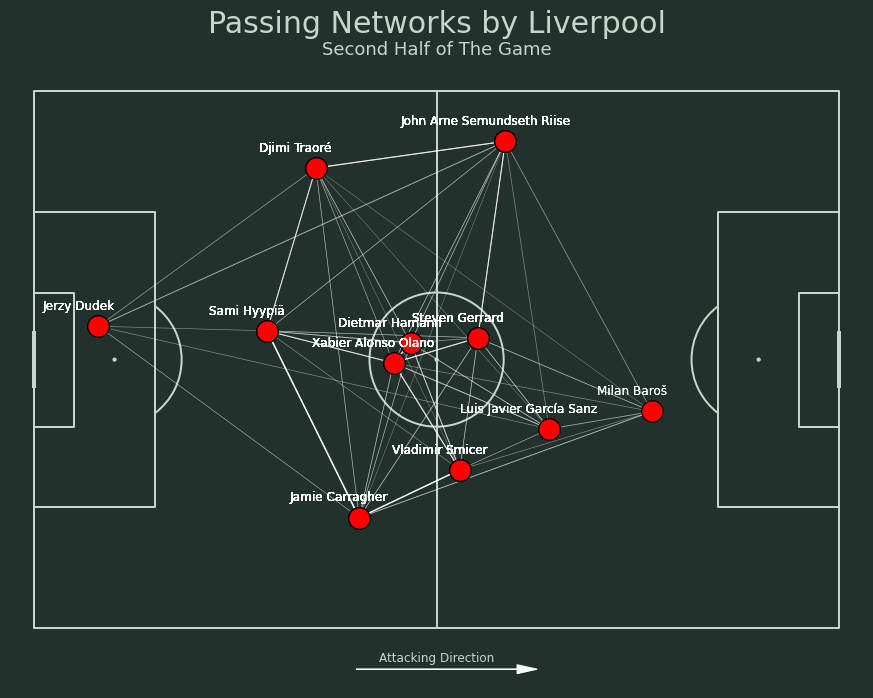
And you can see from Liverpool’s passing network in the second half below, Liverpool’s players shifted towards the right side. This led to more shots from the right and eventually three goals. The defence line of Liverpool also looked more solid in the back as there were more passes between the defenders.
Liverpool’s Passing Network (Liverpool Attacking from Left to Right)
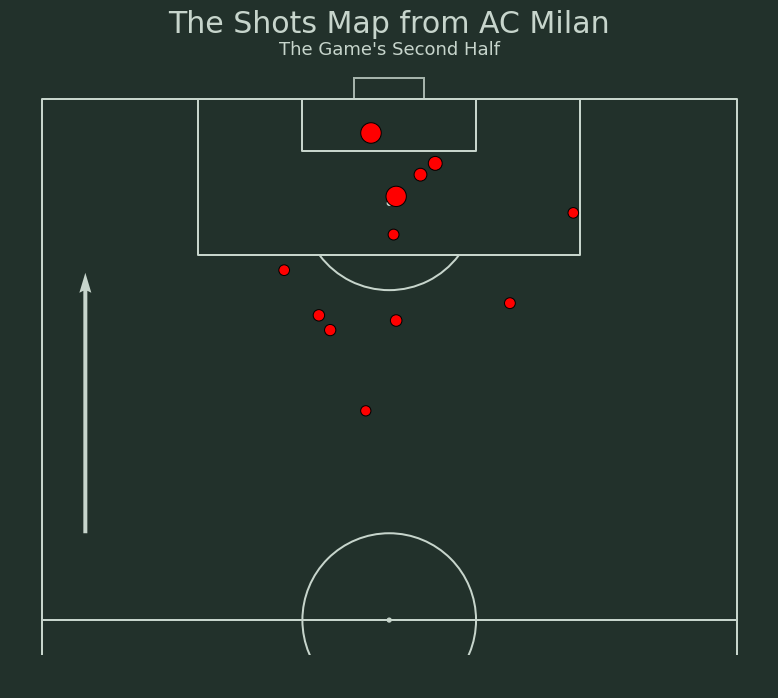
What happened to AC Milan then? Well, the team found it difficult to score despite having more shots on goals than Liverpool. You can see this from the shot map below.
AC Milan’s Shots Map (Circles = Shots)
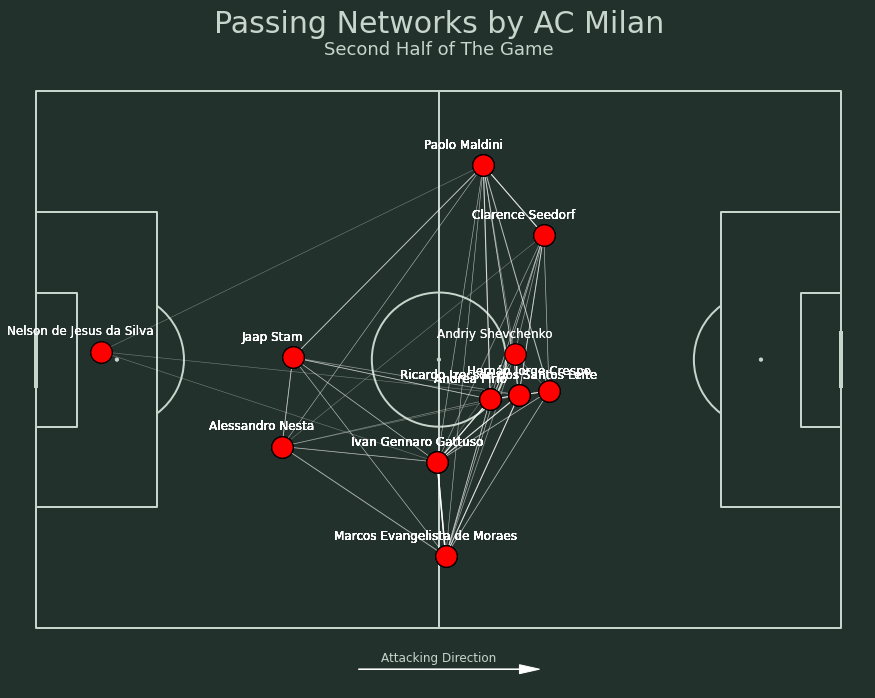
AC Milan’s players’ average positions were quite far away from Liverpool’s penalty box in the second half. Most passes were between Ivan Genarro Gattuso and Marcos Moraes.
AC Milan’s Passing Network (AC Milan Attacking from Left to Right)
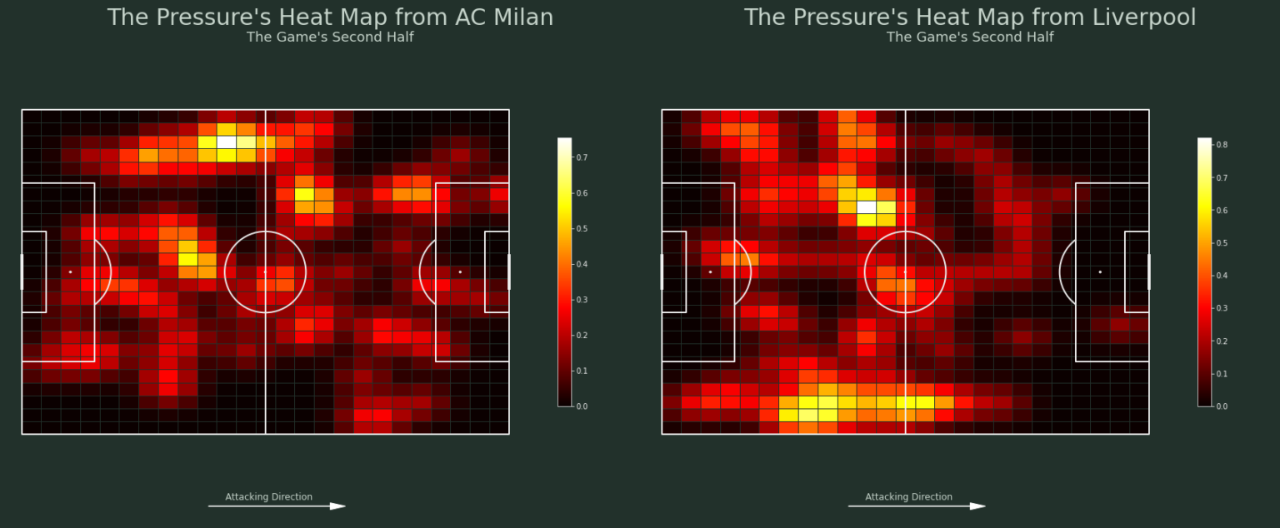
After the equalizer, both teams couldn’t afford to concede any goal so they applied high pressure almost everywhere on the field. You can see that from the heatmap below. The game eventually ended in a penalty shootout. The rest is history.
Pressure Map from Both Teams
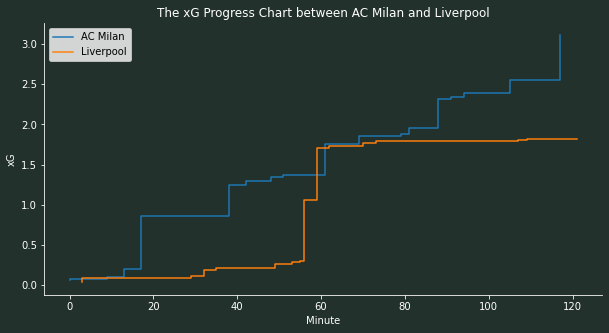
Lastly, I want to show you one more visualization. It is the progress chart of expected goals (xG). The chart tells us about the number of expected goals from each team throughout the game. We can see that AC Milan dominated the game in the first half. When Liverpool came out of the dressing room and changed their tactics in the second half, their xG value immediately went up. AC Milan tried to retake the lead with a lot of shots. Their xG value kept increasing until the end of 120 minutes. Unfortunately, Liverpool’s defence was able to withstand the pressure and they forced a dramatic penalty shootout.
xG Progress Chart
Final Remarks
You have read about how data science can make us understand the soccer game even more. With data science, we can make decisions for getting the desired results. Or, maybe we can make a miraculous comeback just like Liverpool’s did in 2005 .