FINANCIAL SERVICES
Mobile Transaction Forecasting and Anomaly Detection

Capital One is proud of its history of innovation. From the early days, the bank’s leadership has valued the power of information and technology to be able to bring highly customized financial products to consumers and business customers. Today, Capital One is one of America’s most recognized brands, and it continues to lead the way in making banking secure, convenient, and user-friendly. Capital One’s mobile app is rapidly becoming the consumers’ preferred channel for performing transactions with up to 5,000 customers logging into the platform every minute. With such high volume, even small outages need to be identified and resolved quickly, to prevent service disruptions to thousands of people and companies. Capital One turned to H2O to help with modeling of mobile transactions, both for forecasting and anomaly detection purposes. While typical problems, such as elevated failure rate, are relatively easy to detect and measure, other anomalies, including low transaction volume, can be tricky to identify and set up alerts for. Data engineers at Capital One use machine learning to give the operations team an accurate and scalable solution for production monitoring, leading to an improvement in incident detection times and more accurate user activity volume forecasting.
Challenges
To keep its mobile app up and running at all times, Capital One has a dedicated technology operations group, which monitors all of the bank’s critical systems and platforms. Based on company policies, the group configures a number of alerts that are triggered at specific thresholds. While some alerts are straightforward and easy to set up, such as when a certain number of failures occur within a specified timeframe, others, including volume alerts, are notoriously tricky to calculate. A drop in the volume of transactions, or a higher than expected volume can be indicative of a problem, however finding an effective method of creating an alert is far from simple. “Volume is hard to detect, measure, and alert on, says Donald Gennetten, a data engineer at Capital One. “You’ve got volumes that change overtime; you have factors such as the time of day, day of week, and other seasonal elements. When you try to do calculations on volume anomalies, you quickly realize that you have too many distinct thresholds to calculate and maintain.” Gennetten and his team needed a solution that could scale and didn’t require a lot of coding, development, and oversight to manage. “This was the perfect situation for us to leverage machine learning,” he concludes.
Sparkling Water combines the fast, scalable ML algorithms of H2O, the H2O flow UI, Scala, and Python, with the capabilities of Apache Spark. This allowed for really rapid prototyping and ad-hoc experimentation.
Solution
To deliver a usable and scalable solution that also complies with the bank’s strict governance regulations, Capital One’s data scientists turned to platform engineering and open source technology. The team used Sparkling Water to allow them to rapidly test and deploy machine learning. “Sparkling Water combines the fast, scalable ML algorithms of H2O, the H2O flow UI, Scala, and Python, with the capabilities of Apache Spark, “says Rahul Gupta, a member of the data science team at Capital One. “This allowed for really rapid prototyping and ad-hoc experimentation.”
H2O’s advanced capabilities for in-memory processing proved to be an excellent match for Capital One’s big data environment needs; and its ability to support Python, Spark, and Scala enabled a unified coding pipeline for the bank’s many data experts. Additionally, Capital One relies heavily on the grid search option to test models and optimize hyperparameters. “It’s a big timesaver,” adds Gupta. “It helped us move forward toward optimizing and automating the modeling process.”
The team began with the GLM, but quickly discovered that GBM provided far greater flexibility compared to other methods. Traditional time series techniques assume stationary data, without accounting for trends or seasonality, whereas Capital One was specifically looking at how their mobile application usage varies inclusive of those factors. Additionally, the data team at Capital One needed GBM to enable data filtering and exclusions, such as excluding data from events that involved downtime incidents from their training sets. “We don’t want to incorporate bad data when trying to forecast for normal patterns,” explains Gupta. “GBM allowed us to determine which data we wanted to exclude, and which variables we needed to add, such as payment due dates.” For example, Capital One knows that many people tend to pay their credit card bills on a day when they receive their paychecks, which is likely to generate a spike of user activity volume on the bank’s mobile app on Fridays. Traditional time series methods can’t account for this, but GBM provides a lot of variability and is easy to customize.
Open Source, Cloud-based Platform
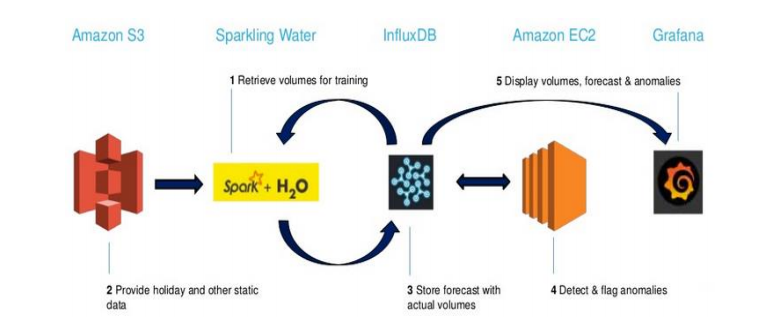
To productize the solution, Capital One needed to build a pipeline that was scalable and repeatable. With their choice of cloud-based, open source platforms and tools, the team built a framework for rapid delivery. Static data is stored in AWS S3; the anomaly detector runs on Amazon EC2; while all other processes run using InfluxDB, a time series database, with virtualization through Grafana. This architecture has made it easy to scale Capital One’s production pipeline, as well as swap out different pieces to accommodate the team’s changing needs.
Results
“Our customers are the operations team – the people who monitor for incidents across the enterprise,” says Donald Gennetten. “This group is under the gun to quickly respond and resolve issues that affect customers, so anything that we could do to give them a clear and crisp picture of what’s going on, is going to be of great value.”
The data team delivers this value by giving the monitoring teams a visual representation of volumes and anomalies. A graph shows actual real-time usage volumes and overlays them with the forecast, so that anyone who is triaging an issue or investigating a root cause of a problem can see where the current volume is relative to what’s normal. The anomaly band, marked with a timestamp, helps a monitoring engineer find the exact time when an anomaly has occurred, allowing them to measure and correlate it to the start time of incidents and other alerts. Messaging alerts help warn the operations team when a problem is detected.
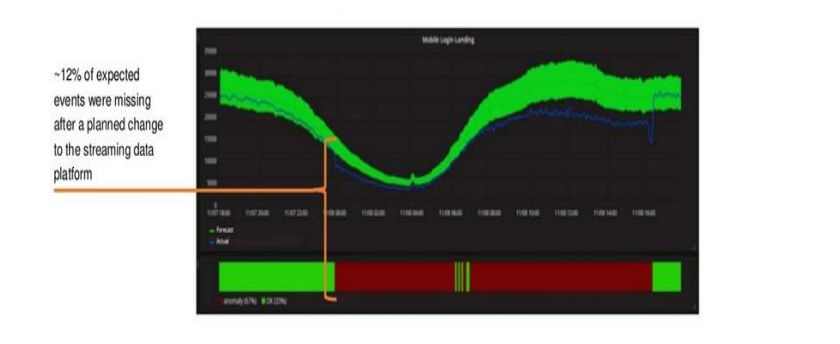
What does an anomalous alert look like? Lower than expected volume triggered an alert, and analysis determined that a problem started at the time of a platform release, which caused dropped data. A code rollback was required to resolve the issue.
Anomaly detection alerts routinely outperform other alarms, leading to faster incident detection times. In one instance, an anomaly alert was sent when a spike in volume was detected at 11:15pm – with over 20 thousand more users logging in as would typically be expected for that time of night. Incident response teams were alerted promptly at 11:17pm, four minutes before any other incident alarms were triggered. “This was a huge win for our customers, and for the teams who are responding to these types of incidents,” concludes Gennetten. “Even the most impressive results are not useful unless the team we are producing them for is able to take this information and actually use it. Having measurable results that show that we are beating the company’s current metrics is a great way to prove to other teams that we have something they can actually use and add to their current methods, to better serve our customers.”
More Customer Stories