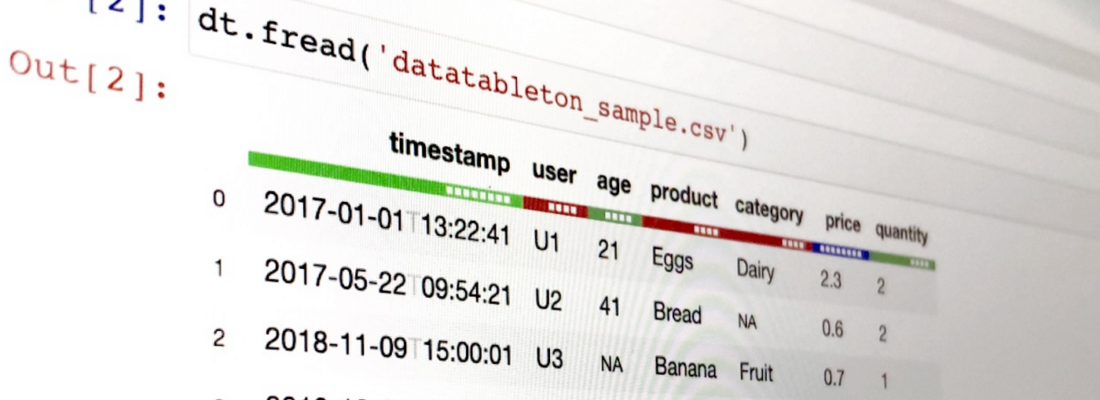
Datatable is a python library for manipulating tabular data. It supports out-of-memory datasets, multi-threaded data processing and has a flexible API.
If this reminds you of R’s data.table , you are spot on because Python’s datatable package is closely related to and inspired by the R library.
The release of v1.0.0 was done on 1st July, 2021 and it’s probably a good time to begin exploring the package.
Notebooks are one of the best forms of learning about packages and deep-diving into them. It is convenient, enables a hands-on experience and often goes hand-in-hand with crisp documentation.
DatatableTon:  datatable exercises
DatatableTon is an open so urce project consisting of 100 Python datatable exercises over different sections structured as a course or tutorials to teach and learn for beginners, intermediates as well as experts.


Learning
data[data.f.set ≥ mylevel]
- For beginners looking to learn datatable from scratch, it is recommended to go through all the sets from the beginning and in order. They are structured to make it easy for newcomers to get started and learn quickly.
- For intermediates looking to up-skill themselves on datatable, it is recommended to start with Set 5 or Set 6 and go through all the subsequent sets in order.
- For experts looking to practise more of datatable, it is recommended to test yourself on the last two sets: Set 9 and Set 10.
Teaching
data[data.f.style == mystyle]
- For teachers looking at exercises to test students on, it is recommended to use all the Exercises style of the sets.
- For teachers looking at tutorials to present or teach with, it is recommended to use all the Solutions style of the sets.
Content
Each section of DatatableTon is a Jupyter Notebook designed to showcase a specific capability of the package ranging from basic setup and data processing to machine learning models and complete projects.
Set 01 • Datatable Introduction • Beginner • Exercises 1–10
- Installation and setup of the package
- Creating and displaying data
- Viewing data and its details
import datatable as dt

data = dt.Frame(v1=range(10), v2=['Y', 'O', 'U', 'C', 'A', 'N', 'D', 'O', 'I', 'T'])
Set 02 • Files and Formats • Beginner • Exercises 11–20
- Reading/Writing csv, gz, jay, zip files or urls
- Integrating pandas, numpy, arrow formats
- Using lists, dicts and tuples with frames
import datatable as dt
import pandas as pd

dframe = pd.DataFrame({'v1': range(11),
 'v2': ['N', 'E', 'V', 'E', 'R', 'G', 'I', 'V', 'E', 'U', 'P']})
data_pd = dt.Frame(dframe)
pd_data = data_pd.to_pandas()
Set 03 • Data Selection • Beginner • Exercises 21–30
- Select row(s)/column(s)/slice(s)/element(s)
- Filter row(s)/column(s) using single or multiple heuristics
- Remove missing row(s)/column(s) and drop duplicates
import datatable as dt

data = dt.fread('datatableton_sample.csv')
data_upq = data[:, ['user', 'product', 'quantity']]
Set 04 • Frame Operations • Beginner • Exercises 31–40
- Change column names and types
- Create, update, delete row(s)/column(s)
- Impute and set missing values
import datatable as dt

data = dt.fread('titanic.csv')
data.replace('?', None)
Set 05 • Column Aggregations • Beginner • Exercises 41–50
- Calculate count, sum, min, max, mean, median, mode, sd, skew, kurt
- Covariance of columns
- Feature correlations and correlation matrix
import datatable as dt
from sklearn.datasets import load_wine

data = dt.Frame(load_wine(as_frame=True).frame)
data.mean()
Set 06 • Grouping Methods • Intermediate • Exercises 51–60
- Aggregating metrics grouped by features
- Comparing column statistics grouped by features
- Combining groupings with filtering and sorting
import datatable as dt
from seaborn import load_dataset

data = dt.Frame(load_dataset('penguins'))
data.replace('NA', None)
data[:, dt.median(dt.f.body_mass_g), dt.by([dt.f.species, dt.f.sex])]
Set 07 • Multiple Frames • Intermediate • Exercises 61–70
- Read, rbind, cbind multiple frames
- Join frames using single or multiple keys
- Union, intersection, difference of frames
import datatable as dt

data = list(dt.iread('datatableton_sample.zip'))

orders_jan = data[1]
orders_feb = data[0]
orders_mar = data[2]
orders_all = dt.rbind(orders_jan, orders_feb, orders_mar)
returns = data[3]

orders_all.key = 'Order ID'
sales = returns[:, :, dt.join(orders_all)]
Set 08 • Time Series • Intermediate • Exercises 71–80
- Extracting and creating date/time features
- Creating lag and lead variables within/without groups
- Calculating difference of dates/timestamps
import datatable as dt

data = dt.fread('datatableton_sample.csv')
data['previous_timestamp'] = dt.shift(dt.f.timestamp, n=1)
Set 09 • Native FTRL • Expert • Exercises 81–90
- Initialization and hyperparameters of FTRL model
- Training and scoring a FTRL model
- Perform k-fold cross validation
import datatable as dt
from datatable.models import Ftrl

data = dt.fread('kdd_ctr.csv', fill=True)[1:,:]
target = data['click']
del data['click']

model_ftrl = Ftrl()
model_ftrl.fit(data, target)
Set 10 • Capstone Projects • Expert • Exercises 91–100
- End-to-end workflow on multiple datasets
- Kaggle competition datasets and actual submissions
- Explore your own datasets and use-cases
import datatable as dt
from datatable.models import Ftrl

train = dt.fread('tradeshift-text-classification/train.csv.gz')
test = dt.fread('tradeshift-text-classification/test.csv.gz')
train_labels = dt.fread('tradeshift-text-classification/trainLabels.csv.gz')

test_ids = test['id']

del train['id']
del test['id']

submission = dt.Frame()

for target in train_labels.names[1:]:
 print(f'Model for target {target}')

 model_ftrl = Ftrl(nepochs=5, nbins=10**8, lambda1=0.1)
 model_ftrl.fit(train, train_labels[target])

 preds_test = model_ftrl.predict(test)
 submission_target = dt.Frame(id_label=test_ids[:, dt.as_type(dt.f.id, str) + f'_{target}'], pred=preds_test['True'])
 submission.rbind(submission_target)

submission.to_csv('submission.csv')
Acknowledgement
DatatableTon is open-source and freely available on GitHub . Special thanks to Parul Pandey & Shrinidhi Narasimhan for collaborating 
This article was first published on Medium .


