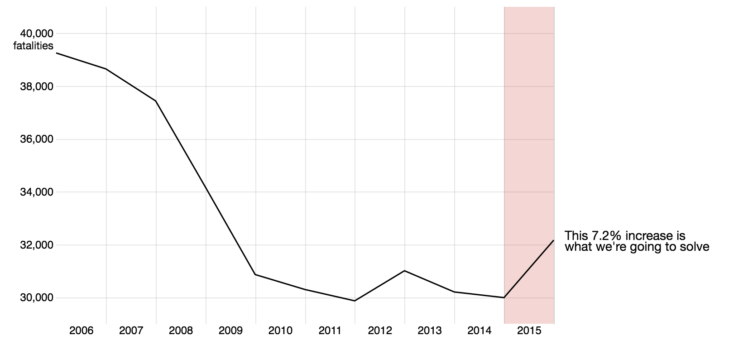
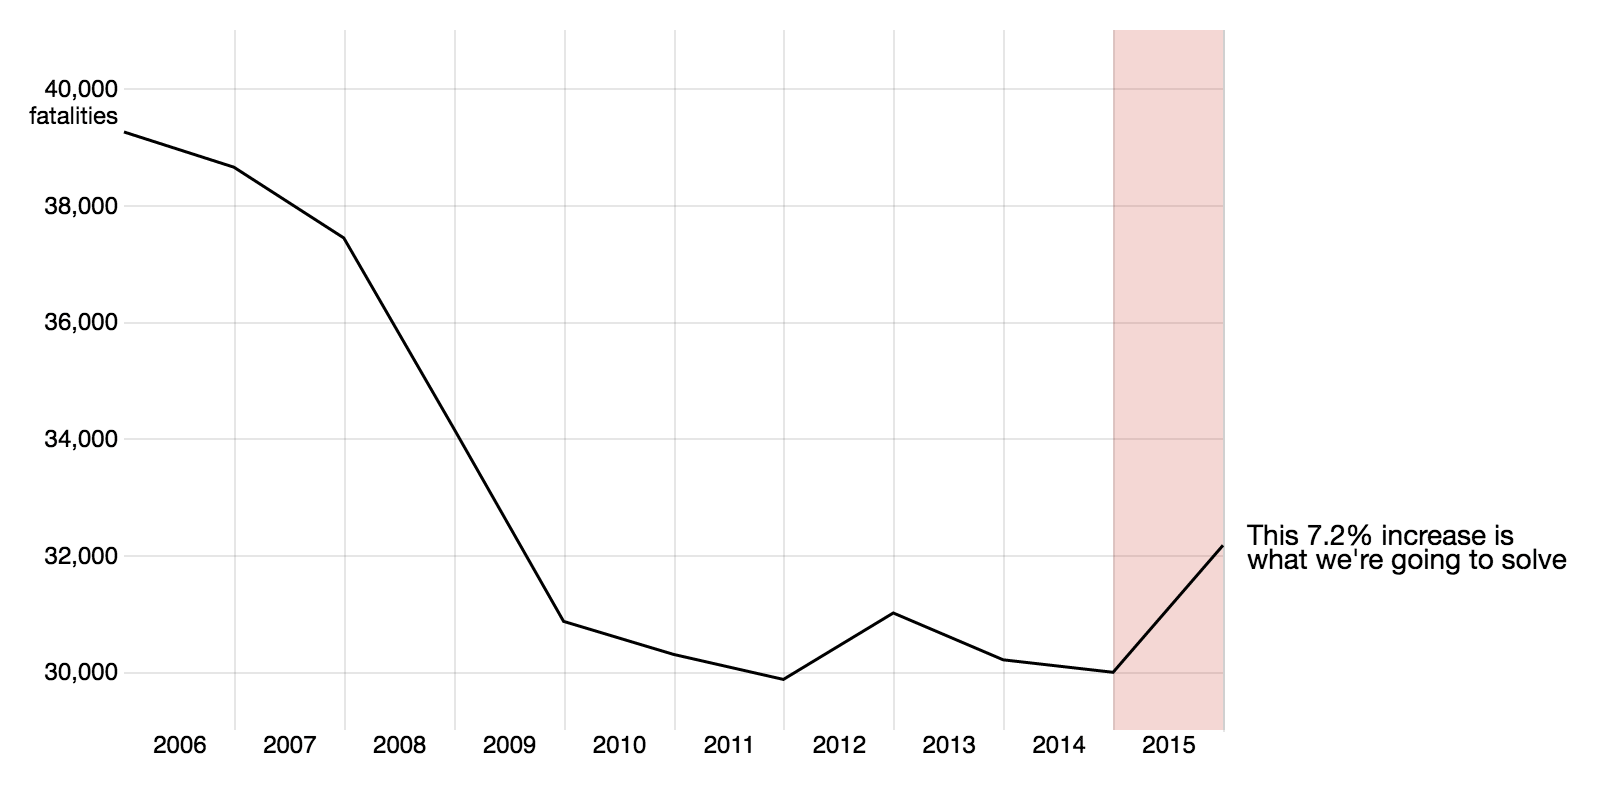
On Tuesday, August 30th, the National Highway Traffic Safety Administration released their annual dataset of traffic fatalities asking interested parties to use the dataset to identify the causes of an increase of 7.2% in fatalities from 2014 to 2015. As part of H2O.ai ‘s vision of using artificial intelligence for the betterment of society we were excited to tackle this problem.
This post is the first in our series on the Department of Transportation dataset and driving fatalities which will hopefully culminate in a hackathon in late September, where we’ll invite community members to join forces with the talented engineers and scientists at H2O.ai to find a solution to this problem and prescribe policy changes.
To begin, we started by reading some literature and getting familiar with the data. These documents served as excellent inspiration for possible paths of analysis and guided our thinking. Our introductory investigation was based around asking a series of questions, paving the way for detailed analysis down the road. The dataset includes every (reported) accident along with several labels, from “involving a distracted driving” to “involving a driver aged 15-20.” Even though fatalities as a whole fell during the last ten years more progress has been made in some areas over others, and comparing 2014 incidents to 2015 incidents can reveal promising openings for policy action.

It’s important to keep in mind that regulations vary from state to state and policy that successfully reduces accidents in one state may not follow to another state. Still, sharing what works and what doesn’t can be important in saving lives, which is one reason why this data is collected and aggregated.
Next week we’ll examine distracted driving, and investigate whether or not the laws that prohibited texting while driving made a difference — and why those laws didn’t continue the downward trend in 2015. We’ll follow that with an investigation into speeding and motorcycle crashes. In the meantime if you have any questions or comments or suggestions you can find me at @JayMahabal or email me at jay@h2oai .
Clarification: September 14th, 2016
We shifted graph labels to reduce confusion.