

Jon Farland is a Senior Data Scientist and Director of Solutions Engineering for North America at H2O.ai. For the last decade, Jon has worked at the intersection of research, technology and energy sectors with a focus on developing large scale and real-time hierarchical forecasting systems. The machine learning models that drive these forecasting systems are used in production today across the globe.
Max Mergenthaler Conseco is the CEO and Co-Founder of Nixtla , a time series research and development startup. He is also a seasoned entrepreneur with a proven track record as the founder of multiple technology startups. With a decade of experience in the ML industry, he has extensive expertise in building and leading international data teams.
Max has also made notable contributions to the data science field through his co-authorship of papers on forecasting algorithms in decision theory. In addition, he is a co-maintainer of several open source libraries in the Python ecosystem. Max’s passion lies in the intersection of business and technology.
Jon Farland:
We’ve been talking a lot about integrating our two technologies together for about six months now. We finally got to a good point where we kind of wanted to talk about that and also talk about generally, you know, some modern themes and forecasting that we’ve both seen.
Introduction to time series
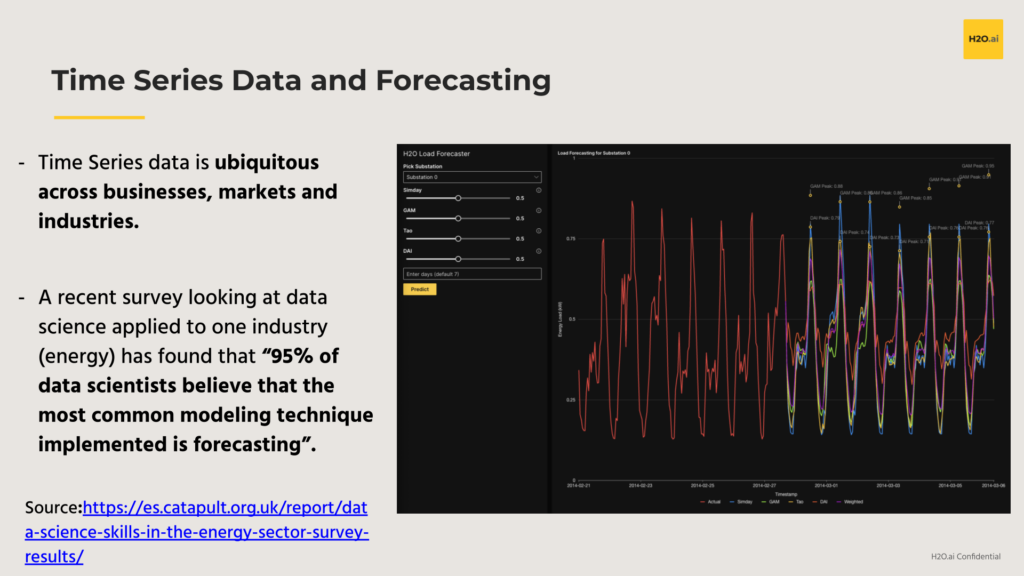
Time series data is absolutely ubiquitous to all parts of our lives. Every business you can think of is probably going to be interested in forecasting into the future, and more importantly, doing so in an accurate and interpretable manner. A recent survey focused on the global energy industry reports that about 95% of data scientists believe that the most common modeling technique implemented is forecasting.
And that makes a lot of sense. Time series data can capture seasonality, trends, repeating business cycles and more, all in a single stream of data. These patterns and oscillations are visible in many time series; the red line in the following graphic represents the historically observed demand for electricity at a high-voltage substation while the colored lines are sets of predictions into the future from an ensemble of various forecasting models.
And this is just considering a single univariate time series. With the advent of smart sensors and in the IoT era, time series data is all around us. Even if the volume of data has exploded in recent years, it can still be very challenging to handle and treat appropriately. Like with most things, from a modeling perspective, data quality plays a huge role here and that is especially with time series. Past data of sufficient quality to facilitate modeling, there are several operational challenges to deploying forecasting models in production:
Real-world challenges of building forecasting systems:
- Data Quality: Intermittent data, sparsity, new time series, missing time stamps, gaps -> garbage in, garbage out principle still applies;
- Predictors themselves may need to be predicted as inputs to forecasting models: If your modeling identifies a good set of predictors for your target variable, you will also need predictions of them as inputs to your production forecasting model;
- Data Latency: How frequently fresh historical data can be made available to forecasting models can add additional time steps to the forecasting horizon, as well as limit the ability to capture any recency effect with autoregressive terms;
- Retraining Cadence and Model Monitoring: Forecasters should think about how to trigger model retraining, whether it be on a set cadence such as weekly, due to a degradation in performance, or drift in the features.
Thinking through these unique challenges to forecasting is critical before deploying your favorite ML algorithm to a production use case. In fact, how one thinks about these challenges should influence the model building process itself. If we know fresh historical records from the day before won’t be available until 8 AM this morning, for example, then we will likely need to account for that additional latency in our forecasting horizon. Even when we’ve arrived at a model or ensemble that we’re happy with from a performance and interpretability perspective, we still need to think about how often is best to retrain the model – should it be on a consistent basis (e.g., weekly) or should it be triggered by an alert that detected a significant change in predictive power? These are the real world challenges surrounding deploying forecasting models for any enterprise.
Thinking through the practical challenges of building forecasting systems is foundational, but there are also many recent developments in forecasting techniques that can be applied to virtually any forecasting situation. In the following section, we take a look at some of the modern themes in time series forecasting.
Modern Themes in Time Series
Over the course of the last 5-10 years, there’s been somewhat of a resurgence in research focused on machine learning applied to time series. For now, we can take a look at some of the major themes in modern time series forecasting, starting off with a topic that is by no means new, but remains a constant source of discussion and research – managing uncertainty.
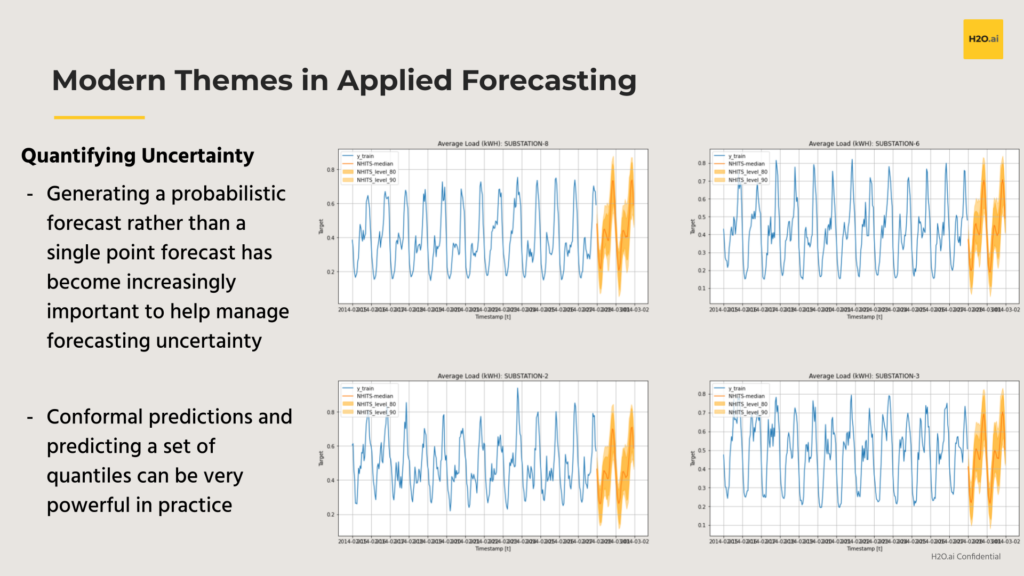
Managing Uncertainty:
The necessity to generate a probabilistic forecast rather than a single point forecast, is becoming more and more important as we try to manage additional volatility. Techniques like conformal predictions and quantile regression have been shown to be very powerful in practice. This graphic shows quantile forecasts as well as the mean forecast across several historical time series:
Hierarchical Forecast Reconciliation:
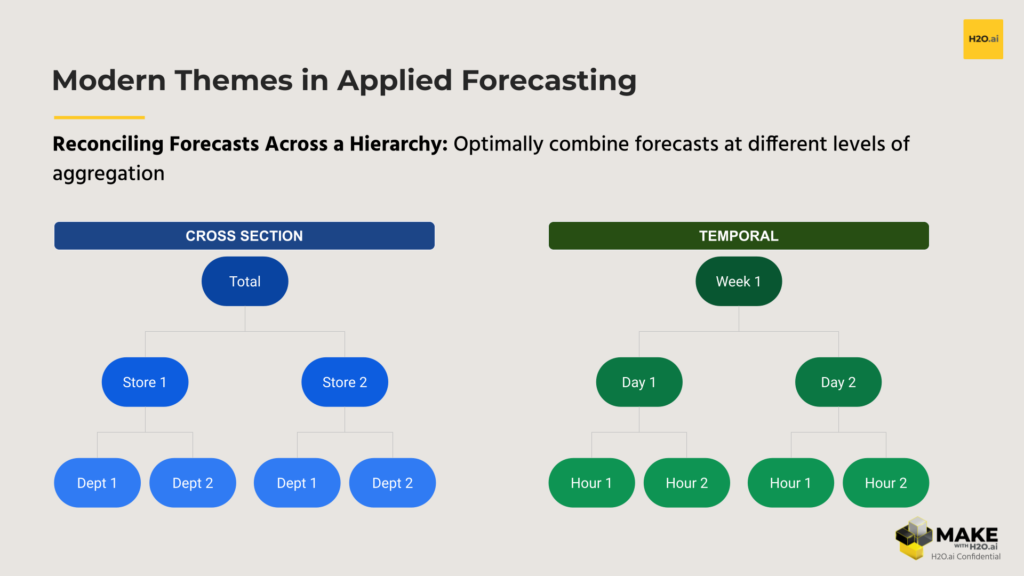
Another really fascinating modern theme here is reconciling forecasts across a hierarchy. Frequently, time series data comes in a way that resembles a hierarchy in some way, shape, or form. Cross-sectionally, you might have products that roll up to a department that roll up to a store, and there’s a grand total there. You might also have data from sensors that can be clustered together in a way that allows you to aggregate to a cluster level and apply a hierarchical approach here as well.
Additionally, you can think of time itself as a hierarchy . Reconciling across a temporal hierarchy is an area of research that is really fascinating and one where I’d expect to see more applied use cases in coming months and years. Especially with more and more higher frequency data being collected, a forecaster has more levels of aggregation to leverage in their reconciliation. With hourly daily, for example, you can aggregate to daily, monthly, quarterly, etc. For each level of aggregation you can generate forecasts from multiple models and leverage what works best at each level. In addition to improved predictive performance, reconciling these forecasts can also imbue the characteristic of ‘coherence’ to these forecasts. A coherent set of forecasts means that forecasts across all levels add up. Here’s a graphic to describe at least two ways to leverage the hierarchical structure of your time series.
Notably, a lot of research recently from Rob Hyndman’s group from Monash University over the last 5 years or so nicely illustrates several ways to optimize forecasts across this entire hierarchy as a post-processing step, regardless of the forecasting models themselves.
Here’s an example of how to do that mathematically: 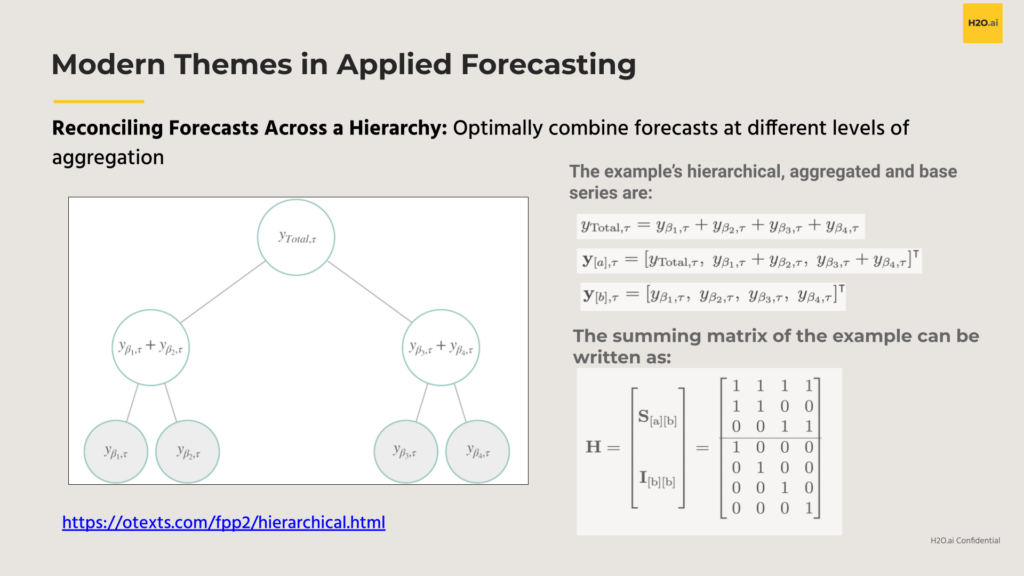
Statistics vs Machine Learning:
Another modern theme of forecasting is the ongoing battle between classic statistical methods and machine learning approaches.
And this goes beyond time series applications – this is just one of those things that people have been talking about for a long time. An attractive part of forecasting is the ability to clearly evaluate performance from a particular model; In other words, there’s a clearly quantifiable error to measure from any prediction. Taking this notion to the next level, we are fortunate to have the findings from several large scale forecasting competitions such as the M-series of competitions from Professor Spyros Makridakis. For the M4 competition, the first place method was an approach pairing per-series exponential smoothing estimates with a global recurrent neural network. In 2nd place, the winner used XGBoost as a means to weight forecasts from more classic statistical methods in an optimal way. For the M5 competition, all of the top performers were all “pure” machine learning methods, where the dominant method was some variation of LightGBM. The most recent M-series competition is the M6 competition which recently concluded and we’re excited to better understand the key findings.
At the end of the day, there are situations where statistical methods will work well and there are situations where machine learning methods will work well. More importantly, what we’re really seeing from these empirical studies is that combining them tends to work even better.
Global vs Local:
Another important concept here is global versus local models, where a local model refers to a model fit to a single time series in isolation and where a global model refers to any model fit to multiple time series.
With the explosion of data that we have available to us, we have a lot of time series now. A particularly salient example here might be the advent of ‘smart’ electricity or water meters which frequently record hourly and sub-hourly data for all of the buildings in a particular city, state, region, etc. The population of smart meters in innovative areas like California in the US have already been generating this treasure chest of data across millions and millions of sensors for years and it will only continue to grow.
Returning back to the decision between local vs global, if one decided to fit a model per time series, there’s a trade off here that one would be making indirectly; Does the improvement in precision or interpretability justify the additional training time required to fit and manage many models? Training a single model per time series in isolation would also ignore the potential information gained from looking at (dis)similar time series. It’s here that the concept of global models comes in. This is another one that’s not necessarily a new concept, but its application to forecasting systems is novel in that now we’re able to train a single model across many, many series.
Global models benefit from the fact that it’s only one model, albeit potentially a large one. While being large, with a global model, forecasters only need to worry about (re)training one model and maintaining one model. One of the major advantages of applying newer deep learning neural network architectures is that the model is able to figure out automatically how to do cross-learning across the time series. In other words, the neural net is learning the similarities and differences between the time series automatically.
This graphic here is from a really pivotal paper. If you haven’t seen this, I definitely suggest reading this paper from Rob J Hyndman and Pablo Montero-Manso on the Principles and Algorithms for Forecasting Groups of Time Series: Locality and Globality .
While being the result of a very active period of research, these themes in forecasting have already made their way into the hands of many practitioners through forecasting tools like H2O, Nixtla, and others.
While being the result of a very active period of research, these themes in forecasting have already made their way into the hands of many practitioners through forecasting tools like H2O, Nixtla, and others.
Nixtlaverse: Bridging Classical and Deep Learning Approaches for Time Series Forecasting
The Nixtlaverse is an open-source set of time series libraries that aims to address the challenges and bridge the gap between classical and deep learning models for time series forecasting. We at Nixtla strive to create scalable, interpretable, and efficient solutions for practitioners across various industries. In this webinar, you will hear Max talk about 5 interesting topics around modern time series practices.
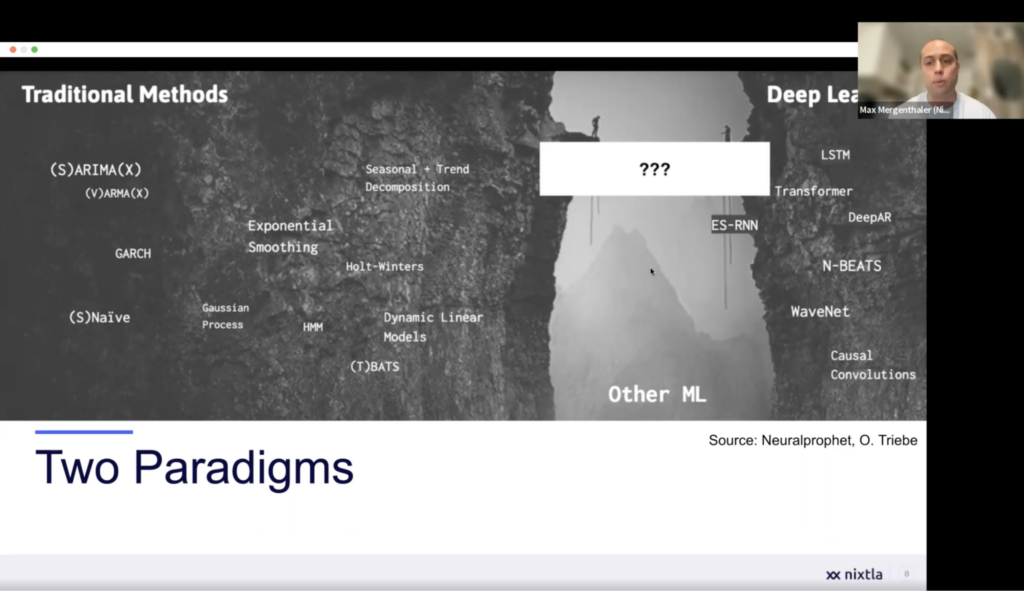
1. The Struggle Between Classical and Deep Learning Models:
Time series forecasting has its roots in econometrics and statistics, with classic models like ARIMA, ETS, and Holt-Winters playing a crucial role in financial applications. These models are still widely used today for their robustness and interpretability. However, the advent of machine learning and deep learning models, such as RNNs and transformer-based architectures, has provided new opportunities for improved forecasting. This has led to a tension between the traditional models and the more recent deep learning models.
2. Building a Bridge Between Traditions:
At Nixtla, we’re committed to developing models that combine the best aspects of classical and deep learning approaches, such as the N-BEATS and N-HiTS models. Our goal is to achieve scalability and interpretability while maintaining the integrity of both traditions. By creating a bridge between these two worlds, we can leverage the strengths of both approaches to offer better forecasting solutions for practitioners.
3. The Nixtlaverse Libraries:
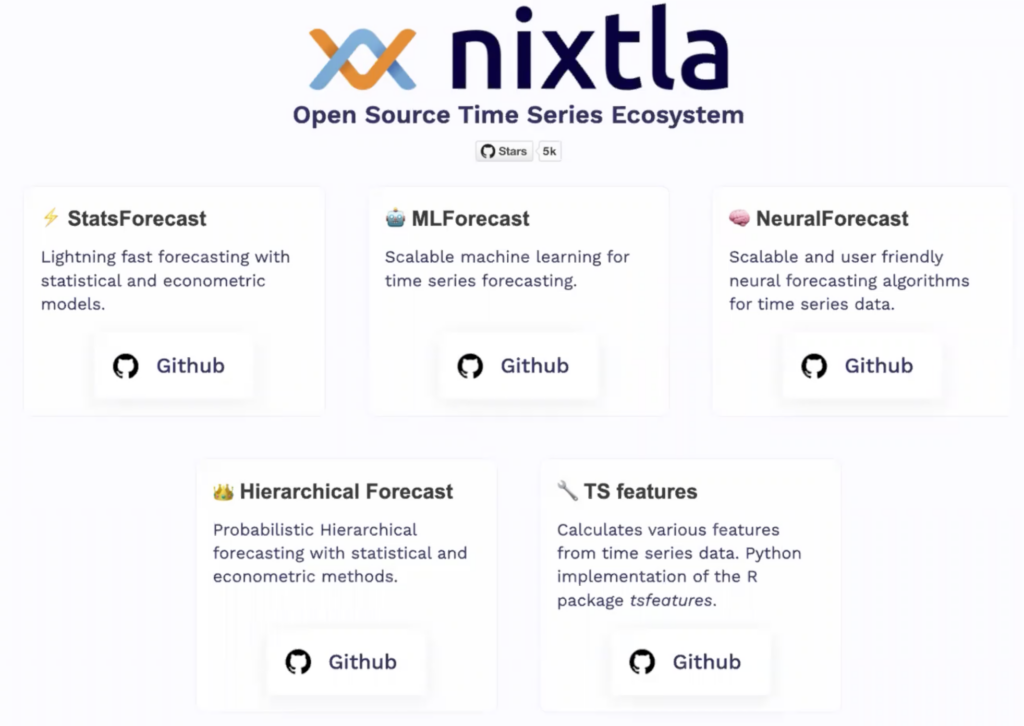
Our suite of open-source time series libraries is designed to enable practitioners to perform a wide range of tasks with time series data. The StatsForecast library contains a collection of fast and optimized statistical models, such as ARIMA, ETS, and Theta families, that can be distributed across multiple machines for efficient training. We also provide interfaces for classical machine learning models like XGBoost and LightGBM, through our MLForecast library, allowing practitioners to easily incorporate these models into their forecasting pipelines. The NeuralForecast library helps implement state-of-the-art neural networks and transformer architectures for time series forecasting, while our HierarchicalForecast library offers tools for building reconciliation strategies for time series data.
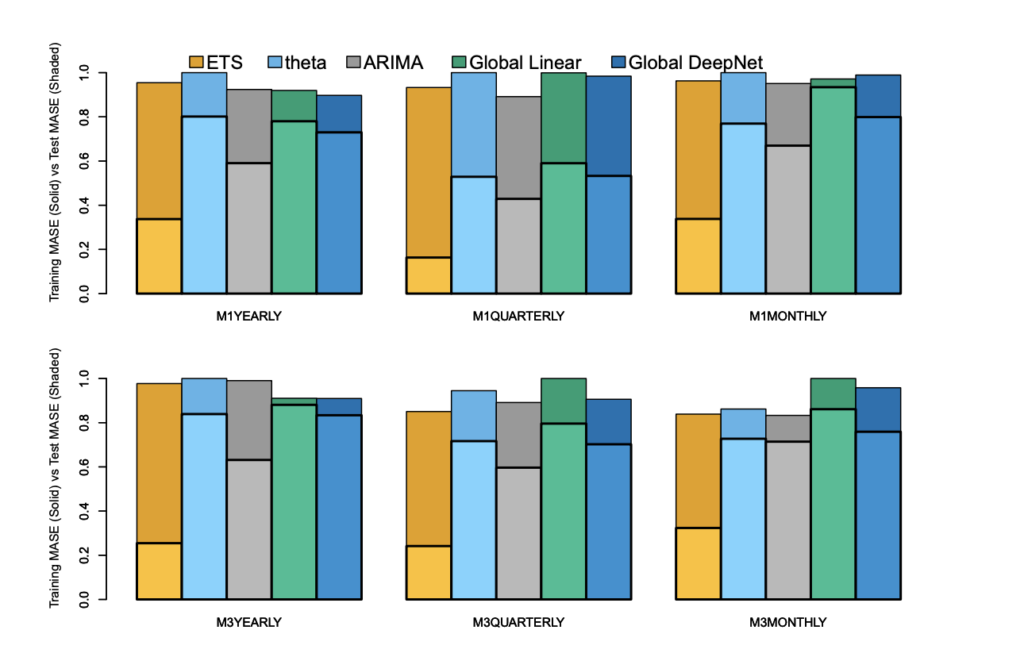
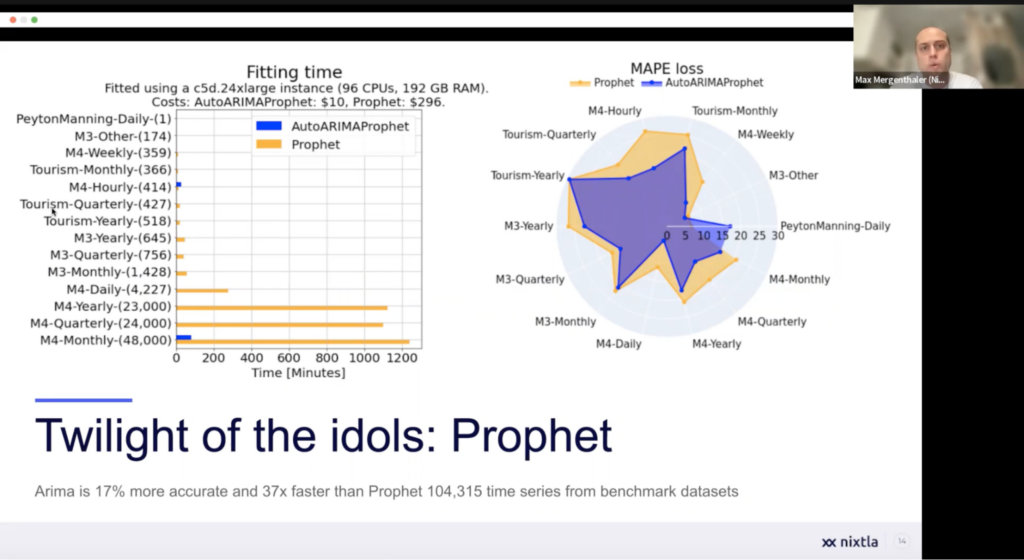
4. Benchmarking and the Importance of Simplicity:
Through rigorous benchmarking, we have discovered that simple statistical models sometimes outperform more complex deep learning models in terms of accuracy, efficiency, and cost. This also applies for many of the commercial out of the box solutions out there. These findings emphasize the importance of using strong baselines, being wary of hype, and considering the relative value of different models. By focusing on simplicity and adhering to first principles, we can develop models that are not only accurate but also efficient and cost-effective.
5. Recommendations for Practitioners:
We advise practitioners to avoid using MAPE as a metric and consider more appropriate alternatives. Probabilistic models should be considered to better quantify uncertainty in forecasting tasks. Additionally, always measure forecasting improvement in terms of forecast value added (FVA), taking into account both accuracy and cost. This approach helps ensure that the models chosen provide the best possible value for the specific forecasting problem at hand.
When selecting models for your forecasting tasks, consider whether global or local models or a combination of both would be most suitable. Evaluate if a multivariate approach is necessary for your specific problem and determine whether point forecasts or probabilistic forecasts would be more appropriate. Also, assess the potential benefits of using ensemble models or single models for your forecasting needs.
Conclusion
We at Nixtla are excited about the future of time series forecasting and our partnership with H2O.ai. We believe in the power of open-source collaboration and the continued development of cutting-edge solutions that combine the best aspects of classical and deep learning models for improved forecasting performance. By working together and sharing knowledge, we can create innovative solutions that address the complex challenges faced by practitioners in the field of time series forecasting.