


GLM and K means to find Social Response Bias - Dating and Fibbers

In any field where data collection is dependent on what your clients, customers, public, whomever …. tell you, there’s the risk that people are big fat fibbers. This often happens because people respond they way they think they SHOULD rather than with their own personal truths. Social sciences and marketing people call this phenomenon social response bias. For instance, customers at car dealerships may pad their figures a little when the Toyota sales person asks them how much they make in salary, and they will likely pad their salary a bit extra when the same question comes up at Mercedes.
Luckily, we don’t have to look very far to find data that allows us to examine this problem in a real world setting, and we can do it in a market that takes no specialized knowledge of behavior, because we’ve all been there. I speak, of course, of the dating market. People are all kinds of fibbers, particularly in the “screening” process, and if the lies that they are telling are grounded in making themselves more attractive to potential mates they should lie in predictable ways.
To examine this we are going to use data obtained from 7,441 men using an online dating website. We have replicates for most of these men (more than one observation for each individual). Because we have multiple observations from each individual, we want to control for effects we might see from a specific person. On the other hand, to control for 7,441 men introduces a HUGE number of parameters into our model, which artificially blows up any model statistic sensitive to the number of parameters we’re estimating (like the AIC).
We expect the amount by which people lie to follow some predictable distribution. When we control for individual what we are really saying is “if YOU, as a person, lie far less than every other person on the planet – I want to account for that.” So instead of controlling for Bob Neverlies as an individual, we are going to find all of the people who are like Bob, and control for similar individuals by groups. As a heuristic, I feel like 10 groups should give enough subtlety to account for individual differences, but 10 isn’t so many groups that we start to loose the advantage of this approach.
The exact steps that I followed to do this in H2O:
- Upload the data
- Parse and inspect
- Run K means setting k = 10, with normalization
- Inspect the resulting 10 cluster centers and see if anything super interesting happened (results are below)
- Apply to data, which generates a column vector corresponding to the rows in our original data
In R I appended the new cluster vector to the data as a categorical variable, and uploaded the new data to H2O. Here’s the code I used to do that:
> response_rec<- paste(response, "h")
> DatingFinalK<- data.frame(response_rec, user_rec, uage, desage, uedlevel,desedlevel, uclaimededlevel, liar_q, liarpos, liarneg, desagedif)
> write.csv(DatingFinalK, file = "DatingFinalK.csv")
For your viewing pleasure here is the output from the cluster analysis that allows us to inspect the centers.
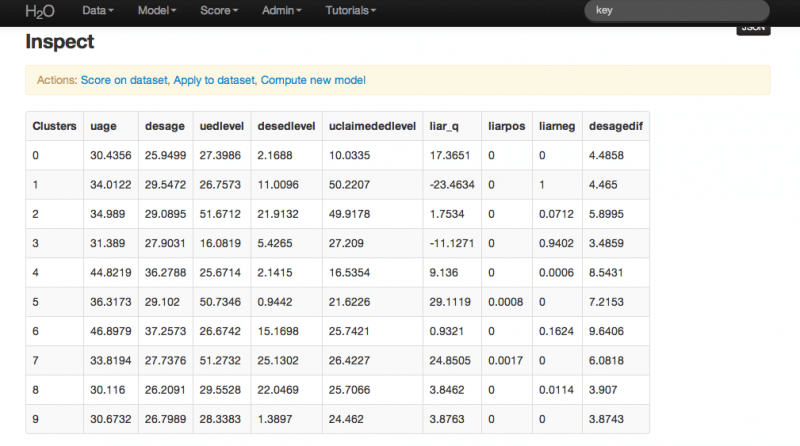
The data are normalized, which means that each of the predicted clusters is grouping observations relative to the mean of the sample (this is different than the mean of the population, which we don’t know). As it turns out, we got something pretty close to what we expected, which were a a few clusters that were somewhat similar to each other, and a few that were well below the mean both in desired age difference and in the degree to which individuals lied (by the way, the attribute about which they lied is their education level – in case you were wondering).
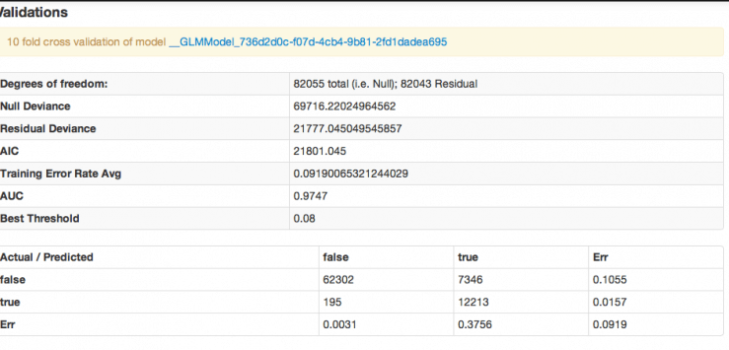
The next step is to run GLM with our new, augmented data set. I ran the GLM in binomial, with a ridge penalty alpha of 0 (which I included by simply entering 0 into the field for alpha, because I expect that at least one variable is biased).
We regressed Liarneg on Cluster, User Age, Desired Age of Partner, User Education Level, and Desired Education Level of Partner.
Here are the model statistics from H2O, and we’ll discuss the coeffs below.
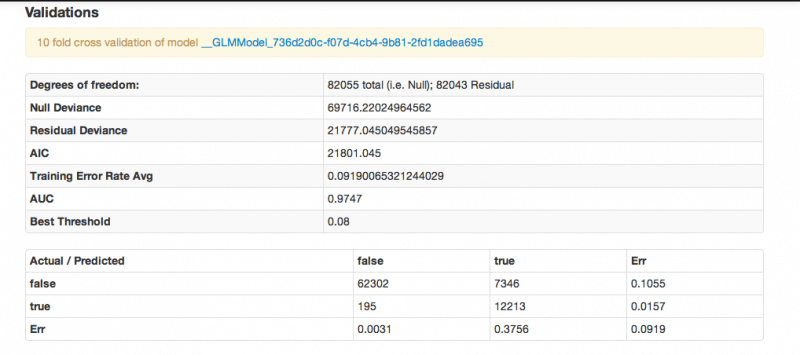
So, our AIC is a bit high, but it’s WAY lower than if run with 7000 categoricals. It also predicts well (very well, in fact). This isn’t surprising, given our bit of magic, and we need to be careful about interpreting that. You see, this model will actually predict less well on a random sample than it did here – this model partially generated by using a predicted variable, which introduces an artificial reduction in the model variance.) This doesn’t mean that we should scrap the model, just that we should apply it will full awareness. Remember that you are actually applying two algos to your data: the first that assigns your population to the clusters we defined earlier, and the second that includes those assignments when you plug their specific conditions into the GLM model to predict. The prediction you get back out is an indication of the extent to which you expect an individual with that combination of attributes to lie about their age, on average.
So what does this model tell us about the world? Relative to group 10, group 1 has a strong positive correlation with lying about their education level. This alone isn’t predictive; it means that we can characterize those who are inclined to lie. This group is of average age (having a group average of about 34). They are have both an education level that corresponds to holding a professional degree, and they are interested in women far less educated than they are. Given the desired education disparity, perhaps they are fibbing to appear more compatible. It is surprising that this group lies at a much higher rate than men with just college degrees interested in less educated women, or men with doctoral levels of education interested in less educated women (groups 3 and 2 respectively).
The other interesting outcome of this can be seen in the regression of normalized coefficients (here we are predicting). As users get older relative to their peers, they are more likely to lie, and this difference dominates even the reduction in the likelihood to lie that comes out of relative increases in education. One possible interpretation of this is that men see being young as a better partner attraction strategy than being well educated; men who are lying about their education are actually under stating it (they are claiming to be less educated than they actually are). It warrants consideration of the question “Are they lying to be consistent with a lie they told about their age?”
Unfortunately that data wasn’t availabe in this data set, and so it is a question that I will leave you with as you go about finding the bias in your own population of interest.