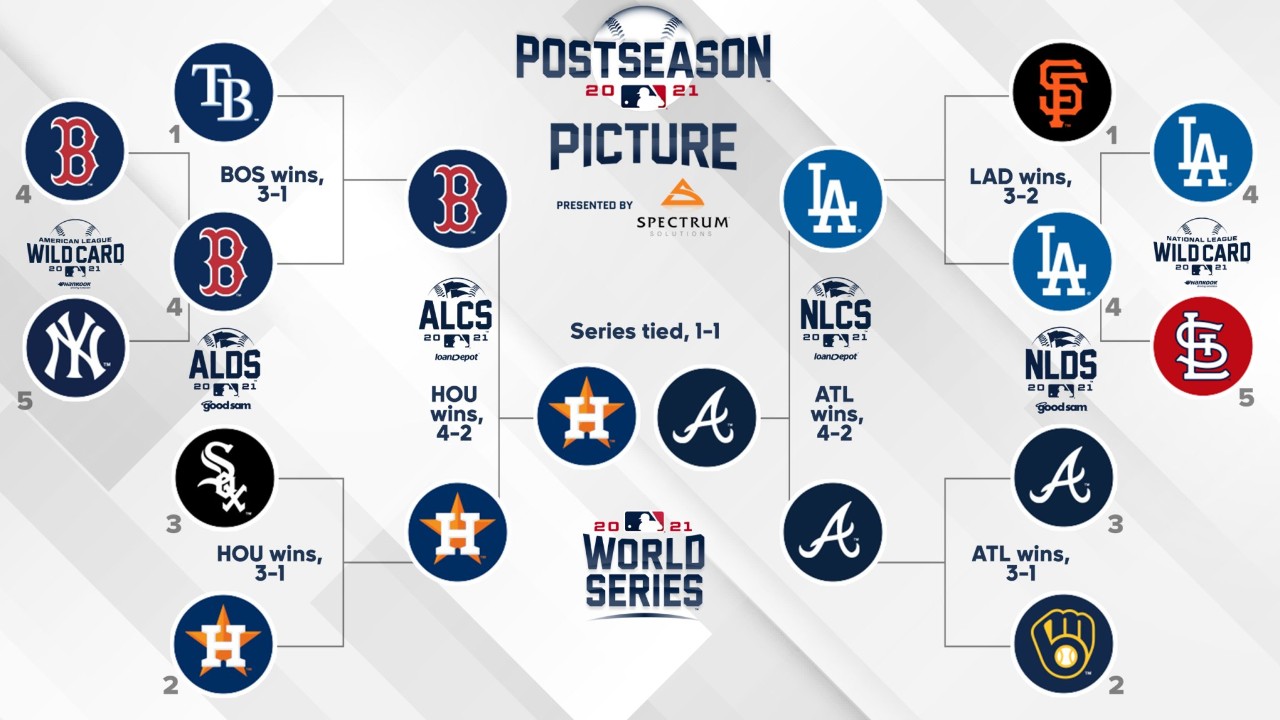
Are you a baseball fan? If so, you may notice that things are heating up right now as the Major League Baseball (MLB ) World Series between Houston Astros and Atlanta Braves tied at 1-1.
MLB Postseason 2021 Results as of October 28 (source)

This also reminded me of the MLB Player Digital Engagement Forecasting competition in which my colleagues and Kaggle Grandmasters, Branden Murray, John Miller, Mark Landry, and Marios Michailidis, earned a second-place finish earlier this year. So here is a blog post about their baseball adventure. You will find an overview of the challenge, their solution as well as some interesting facts about each team member.
The Challenge
“In this competition, you’ll predict how fans engage with MLB players’ digital content on a daily basis for a future date range. You’ll have access to player performance data, social media data, and team factors like market size. Successful models will provide new insights into what signals most strongly correlate with and influence engagement.” – challenge description from Kaggle.
In short, the participants were asked to predict four digital engagement targets based on player/team performance as well as social media data. In order to prevent information leakage, the sources of the four numerical targets in the training set were never disclosed to the participants . John did a post-competition analysis and his hypothesis was that the targets represent typical digital engagement measures such as shares/retweets, likes, mentions, and comments. Yet, no one really knows what the targets mean except the competition organizers .
If you are interested in a data deep dive, you can download the data and check out some of the explanatory analysis notebooks that won the explainability prizes. Below are visualizations from those notebooks.
Mean Target Values from 2018 to 2021 (Source)


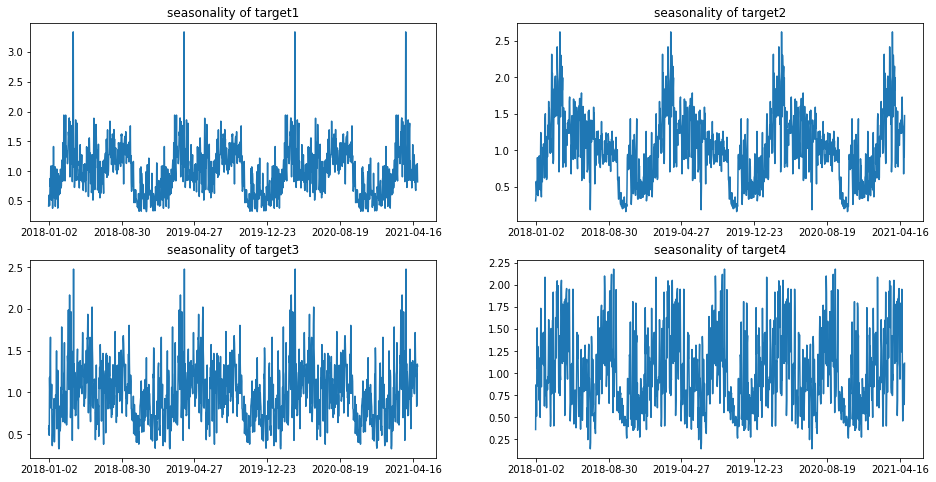
Seasonality of Different Targets (Source)

The Solution – Overview
“Our final model was a blend of five LightGBM models with different settings and one XGBoost
model for each target (24 models in total). The most important features were aggregates
of historical targets for each player, features related to the date, and the number of Twitter
followers. Actual “baseball game” related features that were important were the daily
maximum Win Probability Added around the league (a proxy for if a player somewhere
in the league had a really good game), a player’s current ranking in the home run race,
and whether there was a walk-off somewhere in the league.” – competition summary by Branden.
In short, the team generated some highly predictive features based on their years of Kaggle experience and blended different models together for robust predictions. The outputs are four digital engagement predictions for each player on a specific date. Although the team have no information about the meaning of each target, the predictions are still useful to the competition organizers. The organizers can decode and extract the real digital engagement measures from the numbers .
Samples of the Final Outputs (Source)


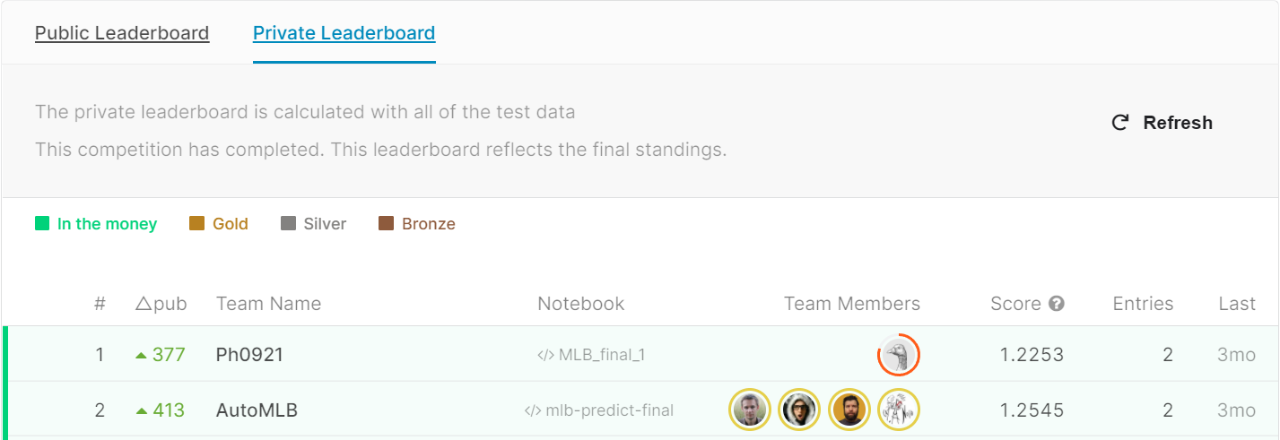
Final Standings for Team AutoMLB (Source)

The Solution – Details
For those of you who are interested in technical details, here is a summary of the models and features. You can check out the end-to-end process from this notebook . Of course, you can also skip this section and scroll down for the fun facts about each team member.
The Six Individual Models:
- LightGBM –
objective="regression_l1" - LightGBM –
objective="regression_l2"– targets scaled by double square root - LightGBM –
objective="regression_l1"–boost_from_average=True - LightGBM –
objective="regression_l1","max_depth": -1 - LightGBM DART –
object="regression_l1",boosting="dart" - XGBoost – targets scaled by double square root
The Most Important Features:
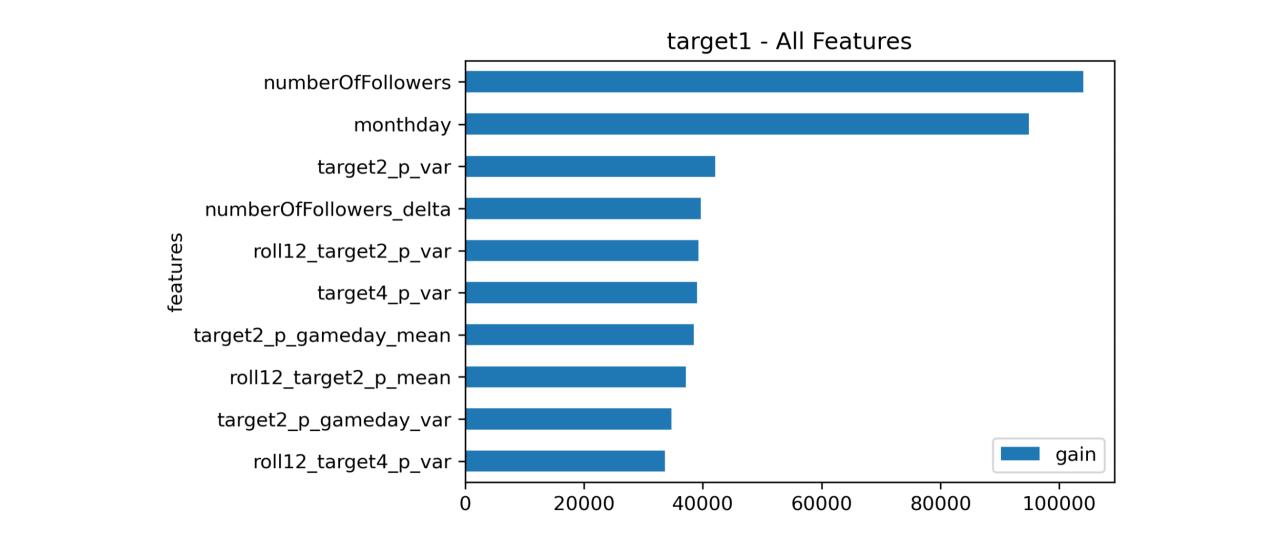
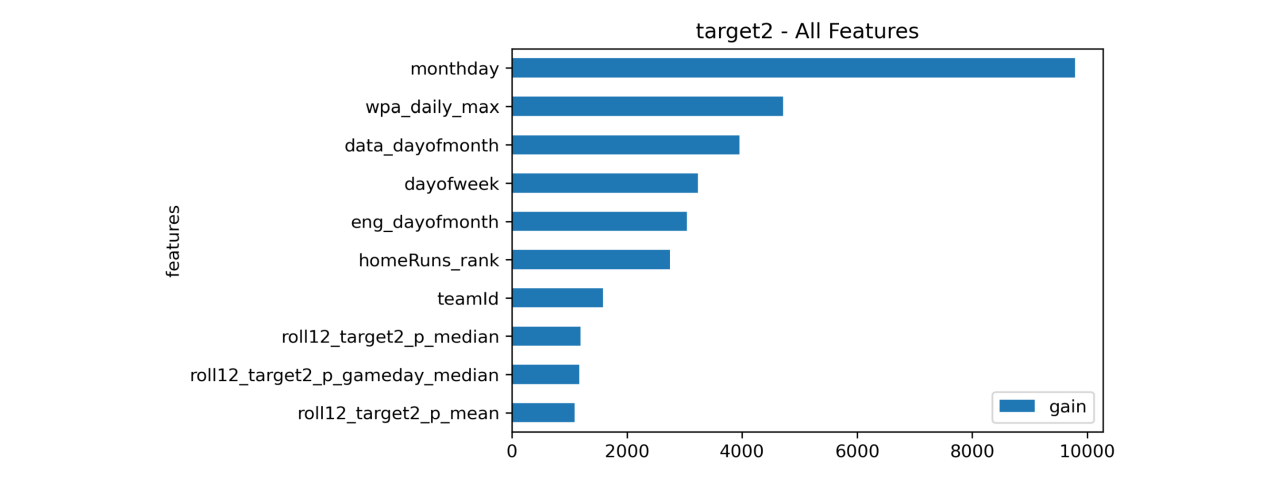
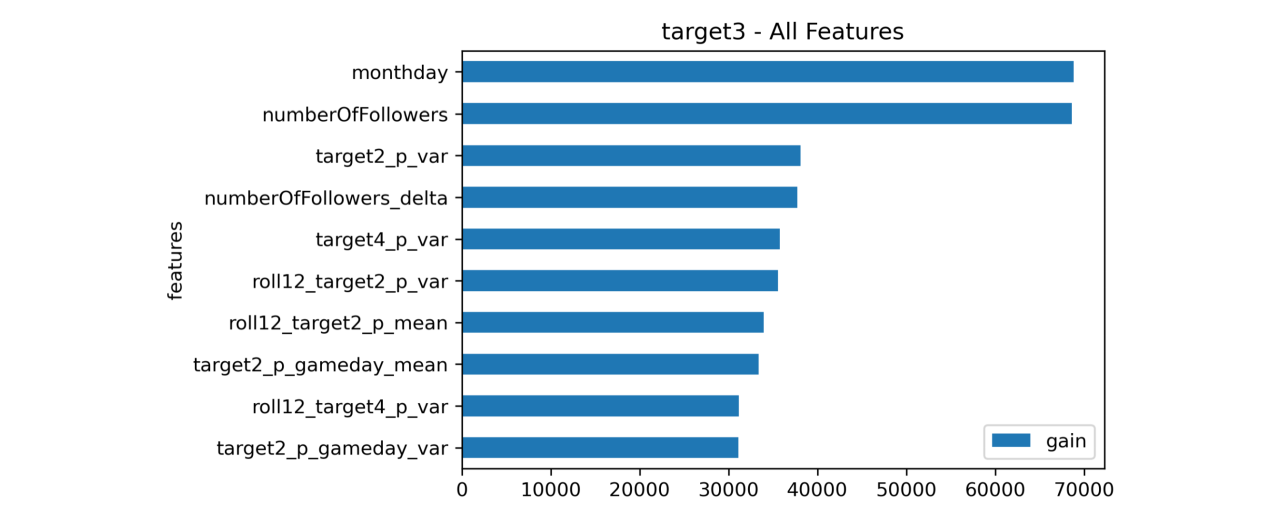
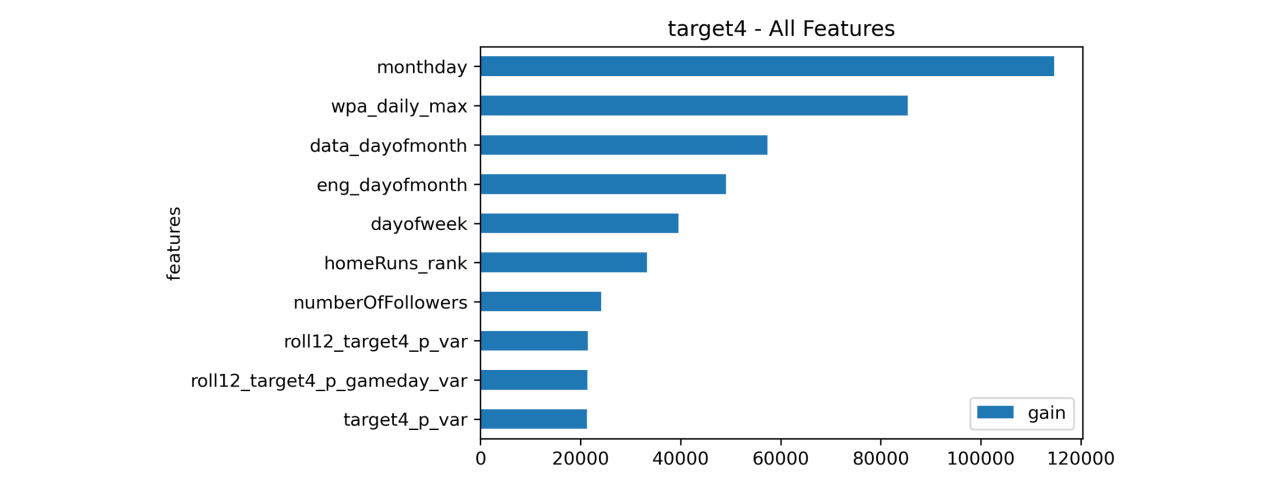
- [numberOfFollowers] The most recent number of Twitter followers
- [numberOfFollower_delta] The change in Twitter followers between the two most recent months
- [monthday] Day of the month
- [targetX_p_var] The historical variance of the target
- [targetX_p_gameday_mean] The historical mean of the target on gameday
- [roll12_targetX_p_mean] The rolling 12-month mean of the target for each player
- [roll12_targetX_p_var] The rolling 12-month variance of the target for each player
- [wpa_daily_max] League-wise daily maximum of Win Probability Added (WPA)
- [homeRuns_rank] Home run ranking for each player
- [A] Was the player active (or not)
- [walk_off_league] Was there a walk-off hit in the league that day?
- [days_since_last_start] The number of days since a player last pitched
Feature Importance (Target 1)
Feature Importance (Target 2)

Feature Importance (Target 3)

Feature Importance (Target 4)

The Team
Now let’s find out more about team AutoMLB:
H2O Kaggle Grandmasters
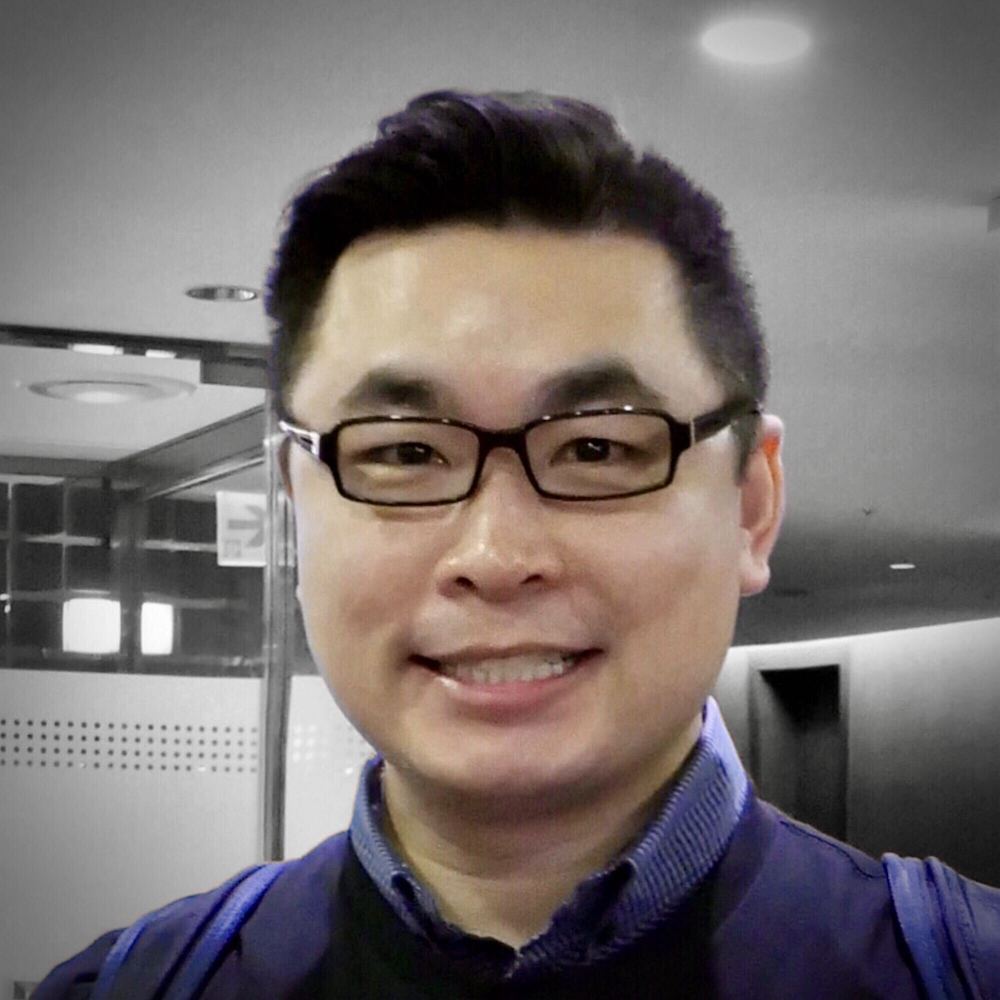
Branden Murray, John Miller, Mark Landry, and Marios Michailidis
(from Left to Right)


What is your academic/professional background?
- Branden: I have a B.S. in Finance. I’ve been a Data Scientist at H2O.ai for 5 years.
- John: I have a BS and MS in Mechanical Engineering and an MBA. I’ve been a Data Scientist at H2O.ai for 2 years. Before that, I worked as a freelance data scientist and operations consultant.
- Mark: I have a B.S. in computer science. I’ve been a Data Scientist at H2O.ai for 6 years, before that 2 years at Dell and 7 years in a variety of data warehousing, reporting, and analytics roles.
- Marios: I hold a Bsc in accounting Finance, an MSc in Risk Management and a PhD in machine learning. I’ve been a competitive Data Scientist at H2O.ai for 4 years. I have led many analytics’ projects with various themes including such as acquisition, retention, recommenders, fraud detection, personalisation, healthcare, portfolio optimization and more.
Did you have any prior experience that helped you succeed in this competition?
- Branden: I have watched a lot of baseball games and spent too much time on social media.
- Mark: I have watched a lot of baseball games (more in previous decades) and found it fun to go through the logs and find certain events and essentially re-engage in MLB this season.
- Marios: No baseball-related experience. I have experience on the ML side due to my work and from past Kaggle competitions.
How much time did you spend on the competition?
- Branden: Probably 140+ hours.
- Mark: Probably 80+ hours. Much of it was trying to understand the data and explore it, but without a direct modelling goal.
- John: Maybe 100 hours or so? In addition, I thought about the challenge a lot when not in front of the computer.
- Marios: Maybe around 15-20 hours.
If you competed as part of a team, who did what?
- Branden: I engineered a lot of the features (last 20 game history, WPA, no-hitters, walk-offs) and trained 4 of the models.
- Mark: I worked on some specific features. The main one that helped was to extend our use of lags. But exploring other features such as whether a starting pitcher was likely to pitch the day of or the next day and looking into the future schedule, investigating robbed home runs, and applying Branden’s win probability features in new ways.
- John: I focused on social media dynamics. Twitter followers, followers of followers, Fantasy Baseball rankings, salaries, team TV budget, local market size, avg game attendance. In the end, we chose not to use any features based on outside data. I also looked at the nature of the targets (like what they indicated) and explored relationships among them.
- Marios: I focused on tuning some of the Lightgbm models that we used. I also did some exploration on the temporal properties of the data that finally decided not to use due to the format of the competition and the uncertainty regarding the forecast horizon.
Key Takeaways
High-quality feature engineering and robust model tuning are the keys to getting the best predictive models. The process of identifying the optimal feature engineering steps and model hyperparameters can be very repetitive and time-consuming. It may also take years of practice to get it right.
The good news is that the process can be automated for many common machine learning use cases. With H2O Driverless AI (part of H2O AI Cloud ), you can leverage our Kaggle Grandmasters’ battle-tested machine learning tricks and build feature engineering and modeling pipelines automatically with ease. Sign up today and give it a try.
Credits
Many thanks to my colleagues mentioned above. Here are their Kaggle profiles:
Bonus Fact
This was not the first time we did something about MLB. A few years ago, I did a Moneyball project which led to a real, multi-million contract. (Shameless plug, I know.)


