


How to Create Your Spotify EDA App with H2O Wave

In this article, I will show you how to build a Spotify Exploratory Data Analysis (EDA) app using H2O Wave from scratch.
H2O Wave is an open-source Python development framework for interactive AI apps. You do not need to know Flask, HTML, CSS, etc. H2O Wave has ready-to-use user-interface components and charts, including dashboard templates, dialogs, themes, widgets, and many more. You just need to customize them for your needs and create your apps with very little effort.
Spotify EDA App

Downloading Spotify Data
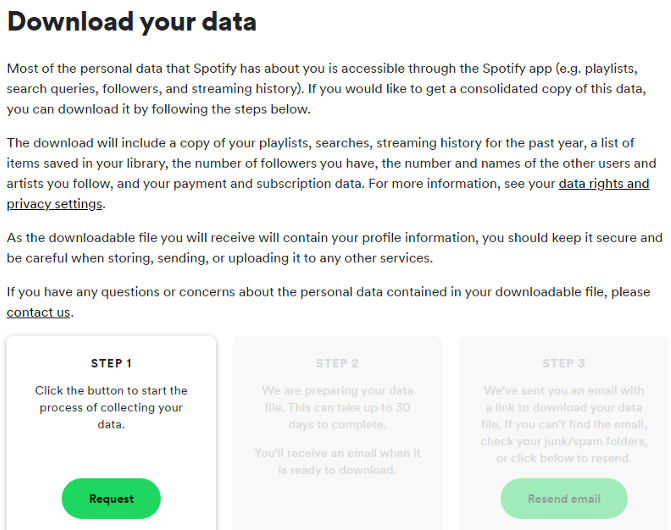
In order to download your data, you have to sign in to your Spotify account. Click on “Account” and you should be able to find the “download your data” section in the privacy settings tab. From there you can request your data. It may take up to 3–4 days to reach your e-mail. Check your files and find the stream history data in JSON format. That is the data we need.
Download Data from Spotify
Installing H2O Wave
To install H2O Wave, follow the instructions here . Please note that the installation process has been simplified since version 0.20 with pip install h2o-wave. You will also need to install data manipulation libraries like Pandas. We recommend installing Wave and other libraries in a virtual environment so do check out the documentation for more information.
Data Preparation
We can use the read_json method from Pandas to analyze our JSON data. After transforming the data into a basic data frame, we will have data like this :
Spotify Data
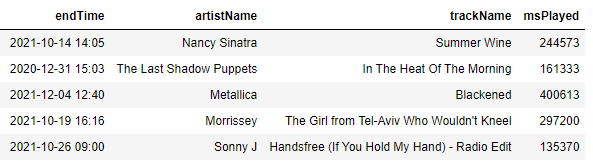
We just have 4 columns: time , artist , track name , and msPlayed – playing time in milliseconds.
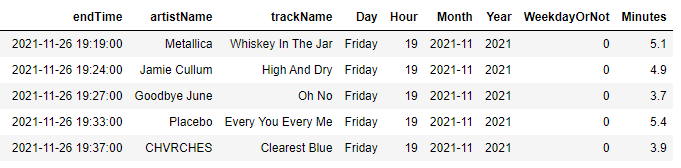
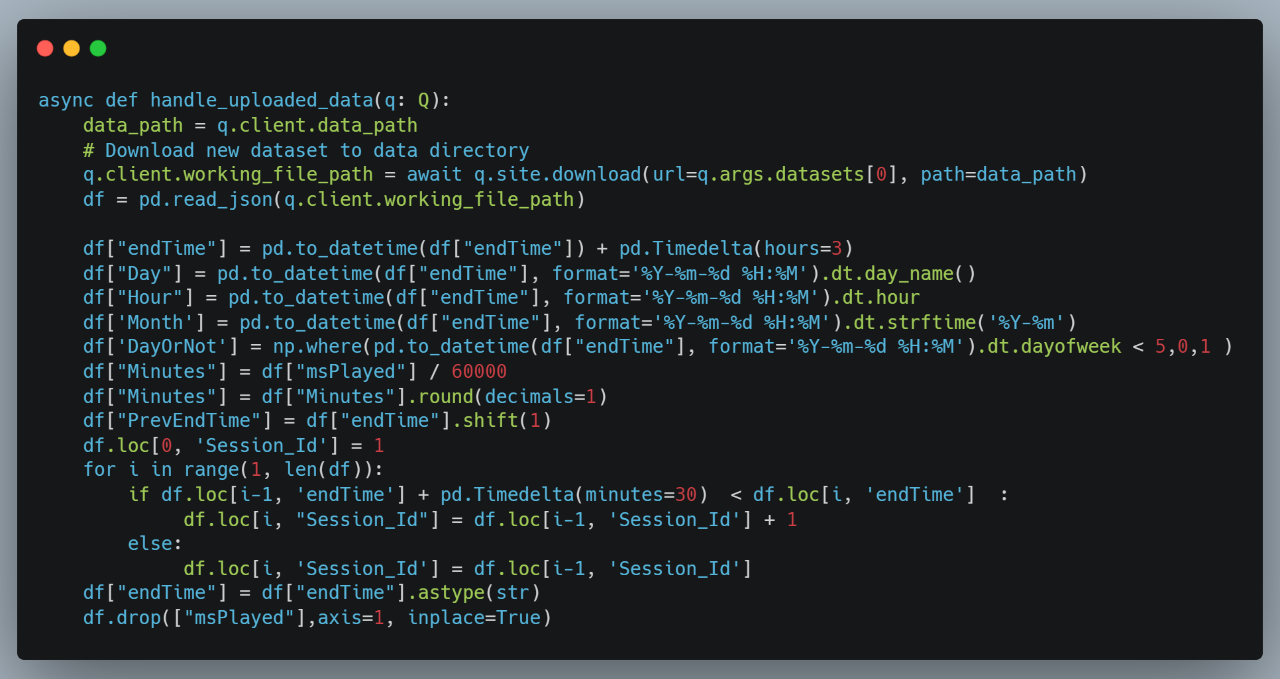
Let’s do some basic feature engineering and create some new features (Day, Hour, Month, Year, WeekdayOrNot, Minutes ) with the script below.
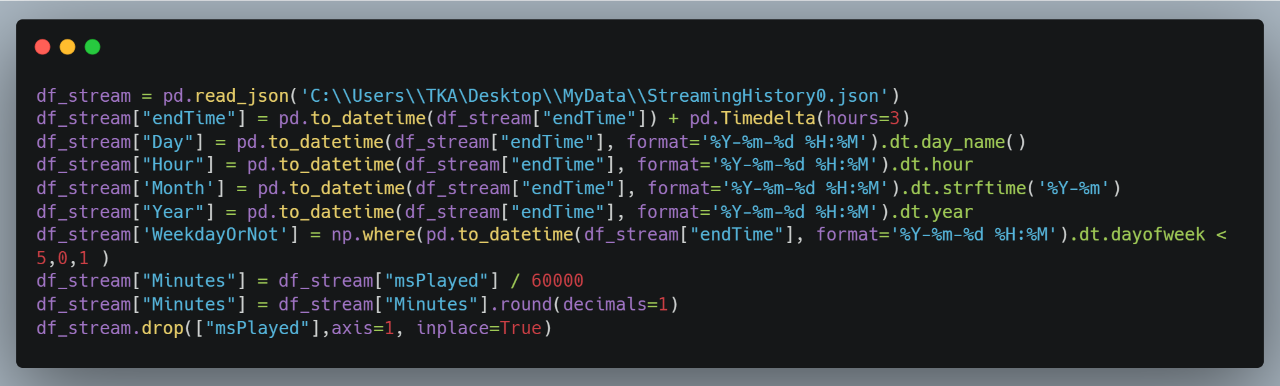
Basic Feature Engineering
Creating Session ID
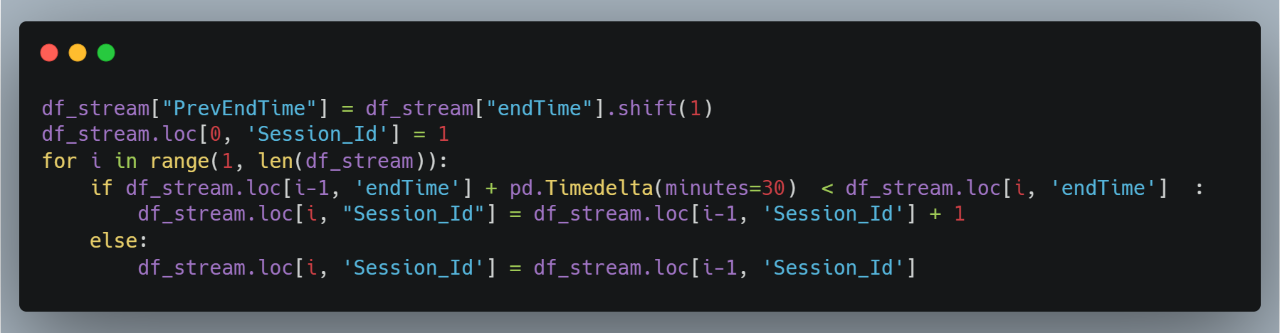
There is no session id in the given data. Luckily, we have the end time for each song. With this column, we can create a fictional session id with the code below. It checks the previous song’s end time (data is sorted by time) and sees if there is a 30-minute interval between the songs. If the time interval is more than 30 minutes, it assigns a new session id by increasing the previous row’s session id by 1. It checks all the songs in the data with a simple for loop.
Adding Session ID
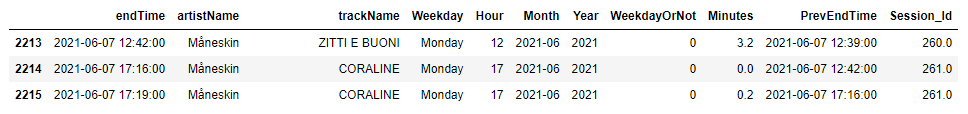
For example, there is a gap of more than 30 minutes between the end time of the first song (12:42) and that of the second song (17:16). Therefore, we increase the session id of the second song by 1.
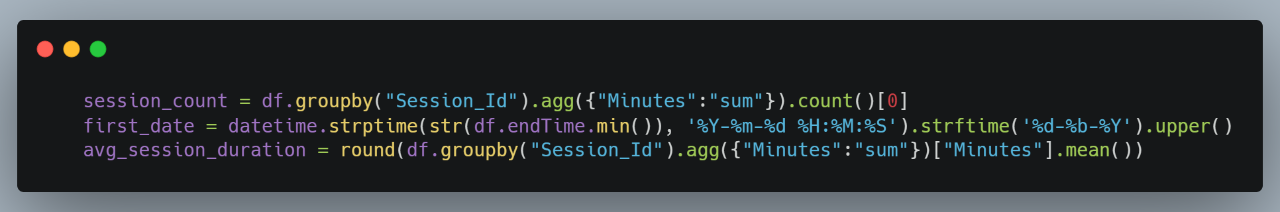
We can now find out how many sessions we have and the average session duration easily by grouping the data as shown below:
Finding the Longest Session
Since we have sessions ids, we can find the longest session and its duration with the code below. We can use the results as new features and feed them into the Wave App later.
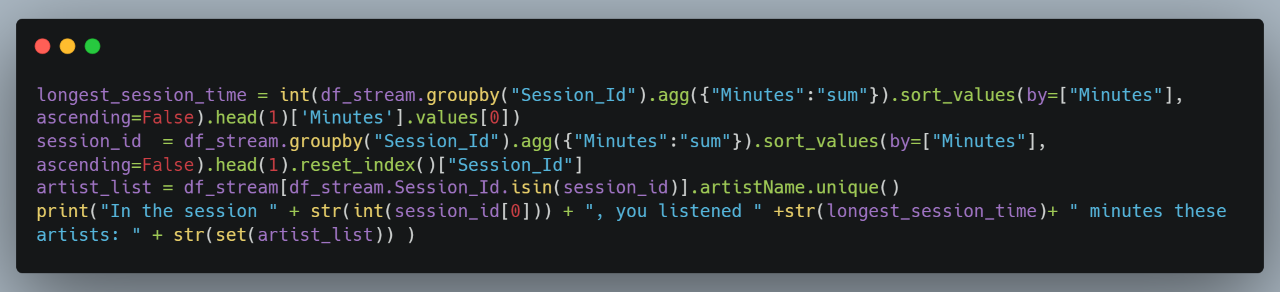
Longest Session

Most Streamed Songs and Artists
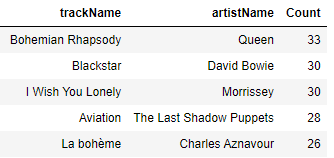
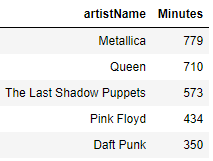
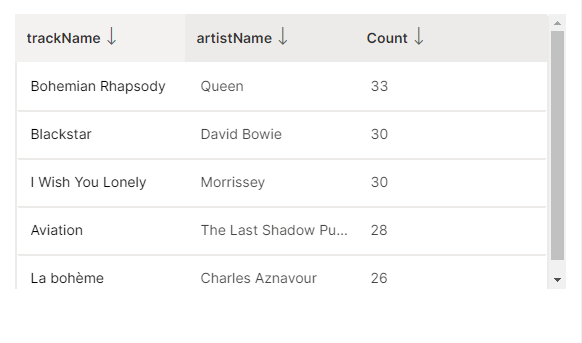
With a simple group by method, we can find the top 5 most streamed songs and artists as shown below:
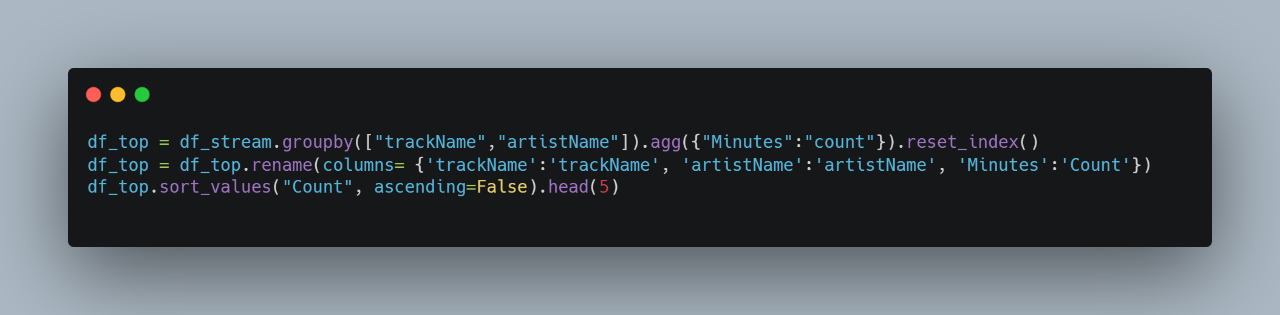
Top Songs
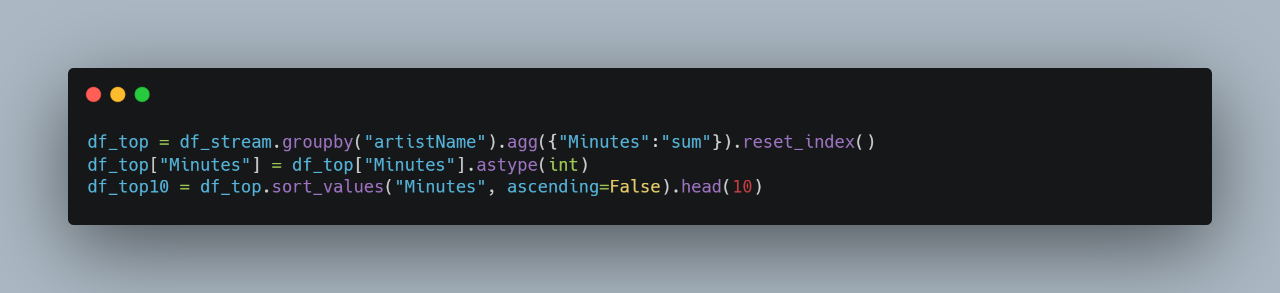
Top Artists
Most Streamed Artist by Month
Now, for our Wave app, we will create a new data frame that shows the most listened to artists for each month. We can create a rank column and give a value according to the total minutes played. After that, we can filter the data easily and find the first ranked artist by month.
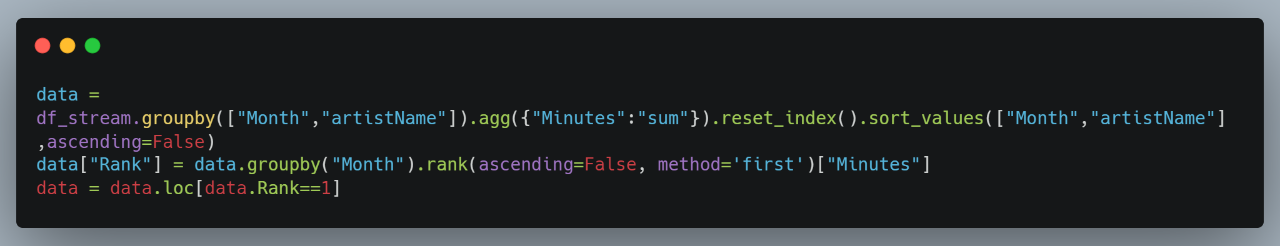
Most Streamed Artist by Month
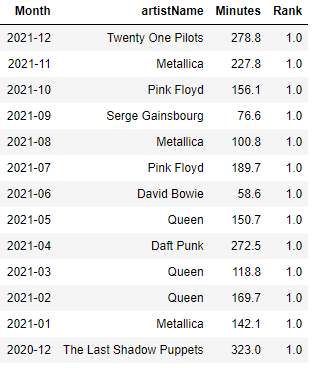
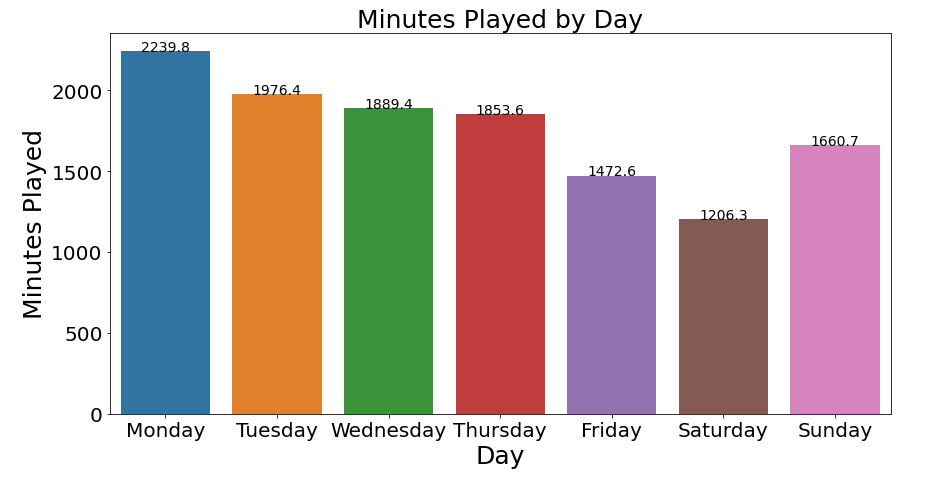
Hour, Day, and Month Trends
Similarly, we can use the groupby method to visualize other trends.
Visualizing Trends
Putting Everything Together – H2O Wave App
We want our app to be interactive so that users can upload and analyze their own Spotify data.
For the Wave app, we just need one python file. It starts with @app decorator and the page name (e.g. /spotify). @app is just a decorator for your query handler (or request handler). After that, we have a function that defines the page design. In a Wave app, we can access the page using the query context q. The query context carries useful information about the active UI event, including who issued the event, what information was entered, which buttons were clicked, and so on; and q.page always refers to the page defined at the decorator route @app('/spotify') (in this case).
To add a card for data upload, we visit the H2O Wave example features section here . We need to create a q.page["Stream_History"] section and fill it with a ui.form_card card object. In Wave apps, we can add card objects to pages and fill the page with these cards. We can think of these cards as the base design units. Inside this card object, it should be a text file card to show our messages to users and a file_upload card that enables uploading the file to the system.
What about the positioning? That is easy. Using the ui.form_card card object, we can define the card position on the screen with the box method. For example, box = '1 1 3 6' means “from the first column and first row, create a card with a size of 3 columns and 6 rows “.
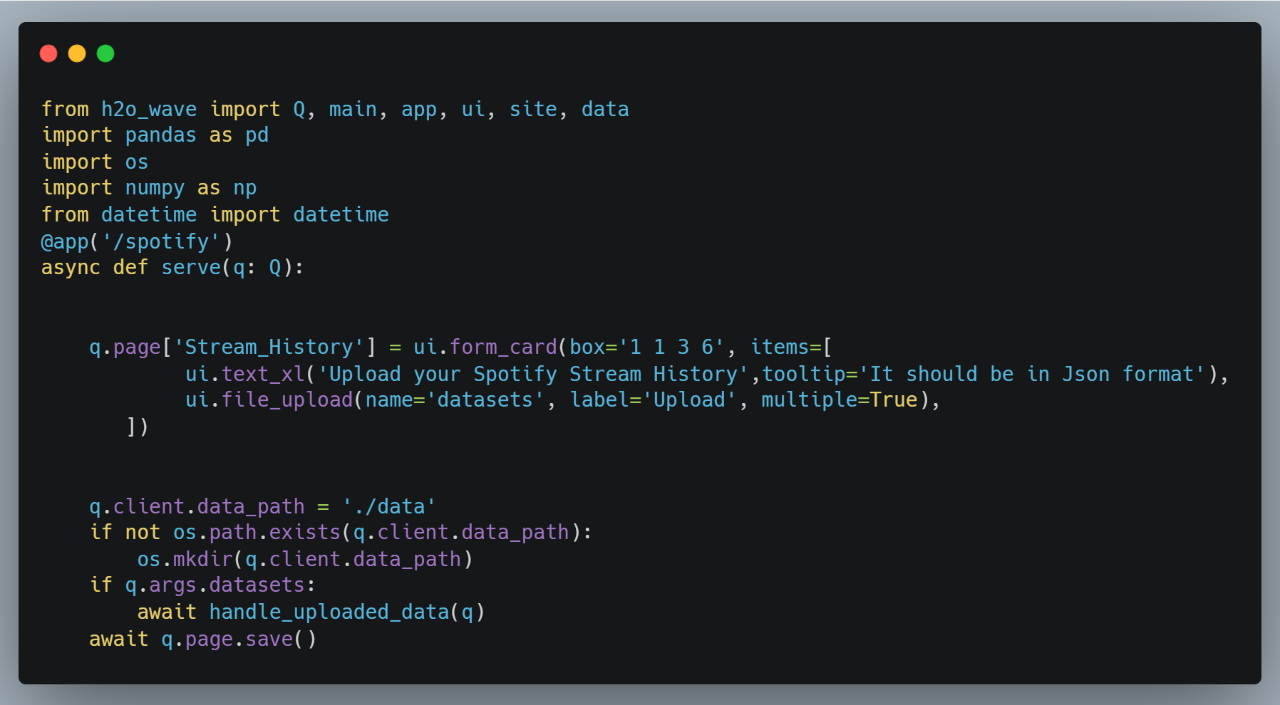
After that, we can define q.client.data_path, if there is no folder in the user server, we can create a new folder. When the user uploads data, q.args.datasets ( we named it as ‘datasets’ in file_upload card) will be instantly created with the uploaded file. So we can write an if function. If it is true/we have submitted data, we can call another function and show new cards to the user with the new function (handle_uploaded_data).
This is the landing page with the first “upload data” card
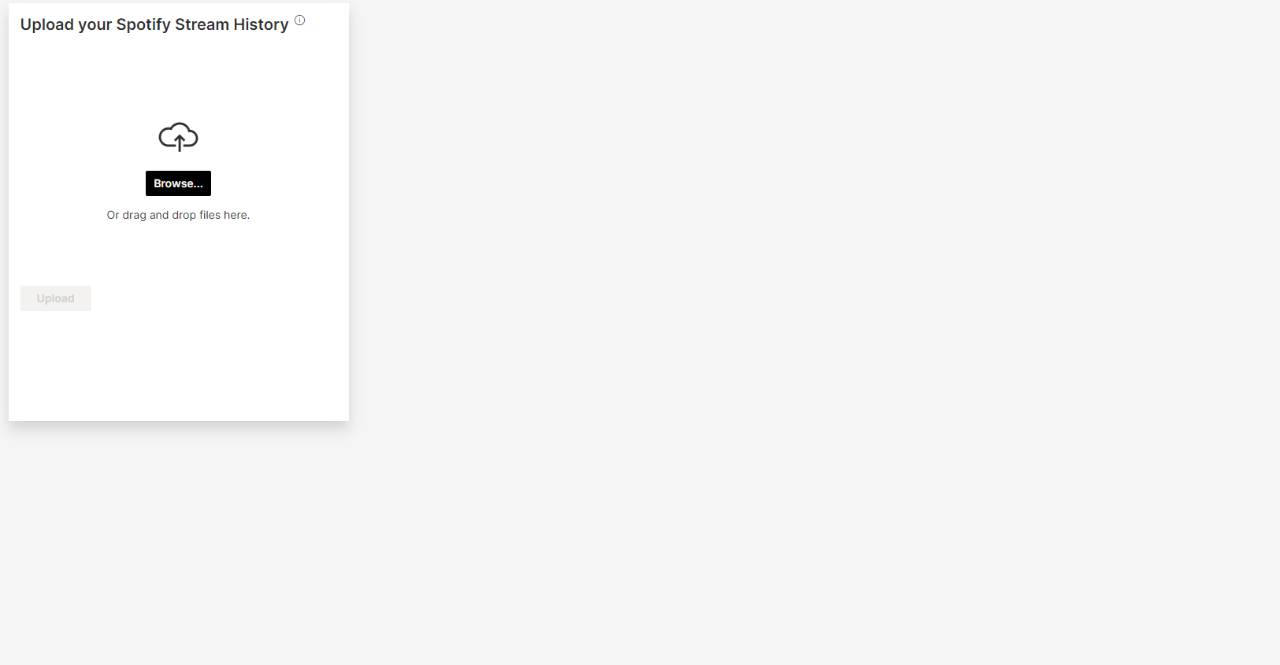
We see that our “Upload Data ” card starts from the first column/row (zero point for the screen) and with a size of 3 columns and 6 rows.
In the handle_uploaded_data function which we call after any data upload, there should be some code for data preparation and data visualization. First, we record our data as q.args.datasets in memory. We download the data to the client with q.site.download method and get the name of the path. With that, we can carry out the data manipulation steps as mentioned above.
Adding More Visualizations
Let’s add the most liked artist for each month’s analysis as a graph. First, let’s check out H2O Wave App Gallery for ready-to-use plot codes:
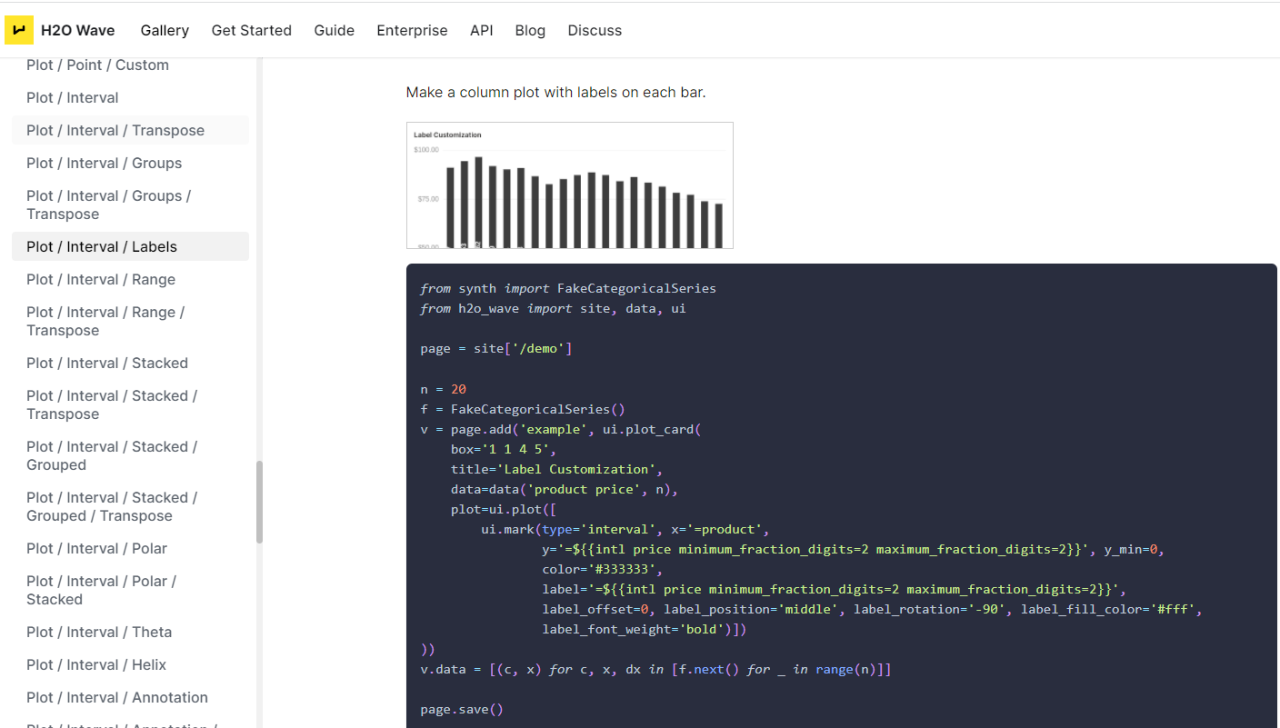
We can create a ui.plot_card and fill it with relevant information. First, we prepare a df_monthly_artists data frame showing the most streamed artists by month. Then we can use ui. plot card to visualize the data as shown below:
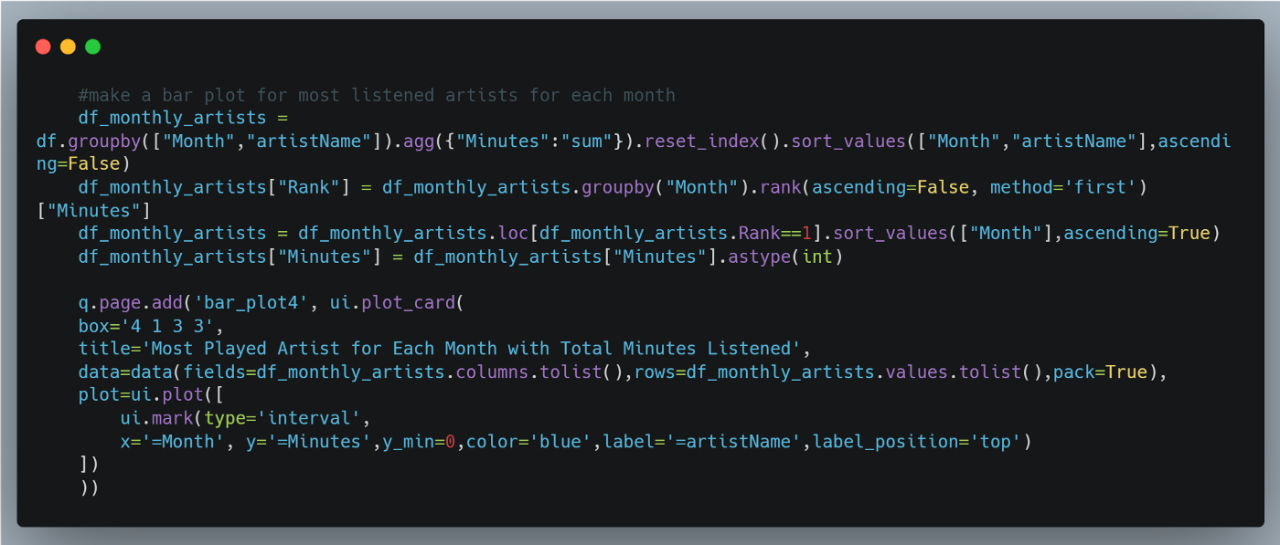
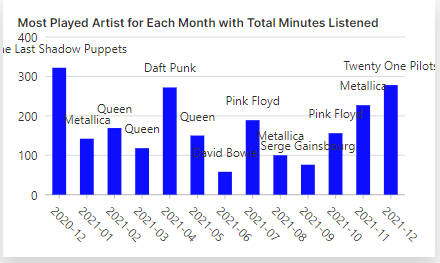
For this graph, we can use box=[4,1,3,3] so it will be shown next to the “upload data ” card. The graph should look like this:
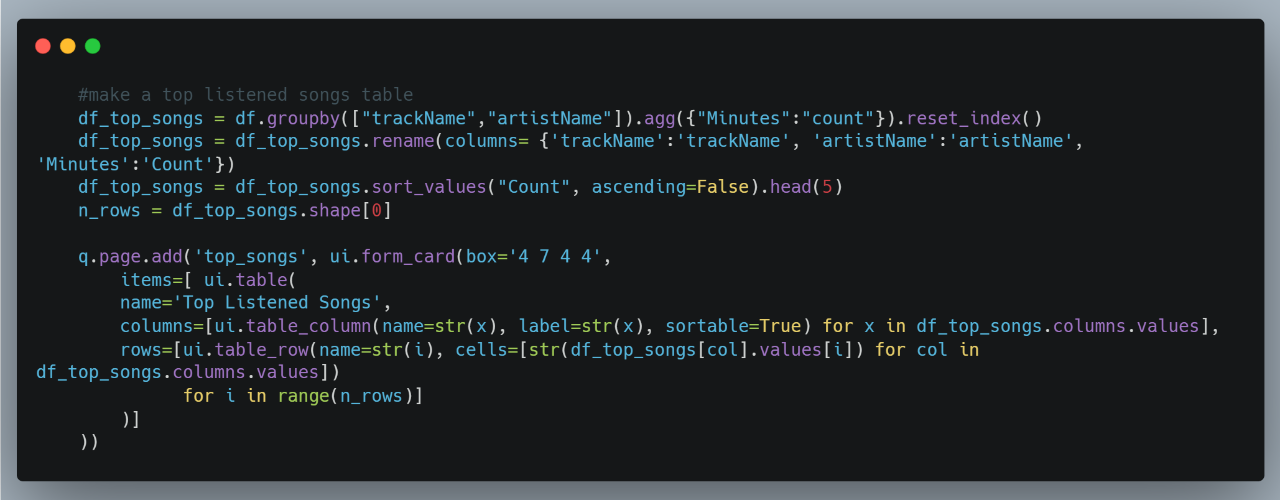
Adding a Table
Let’s look at the Wave App gallery again for another code example .
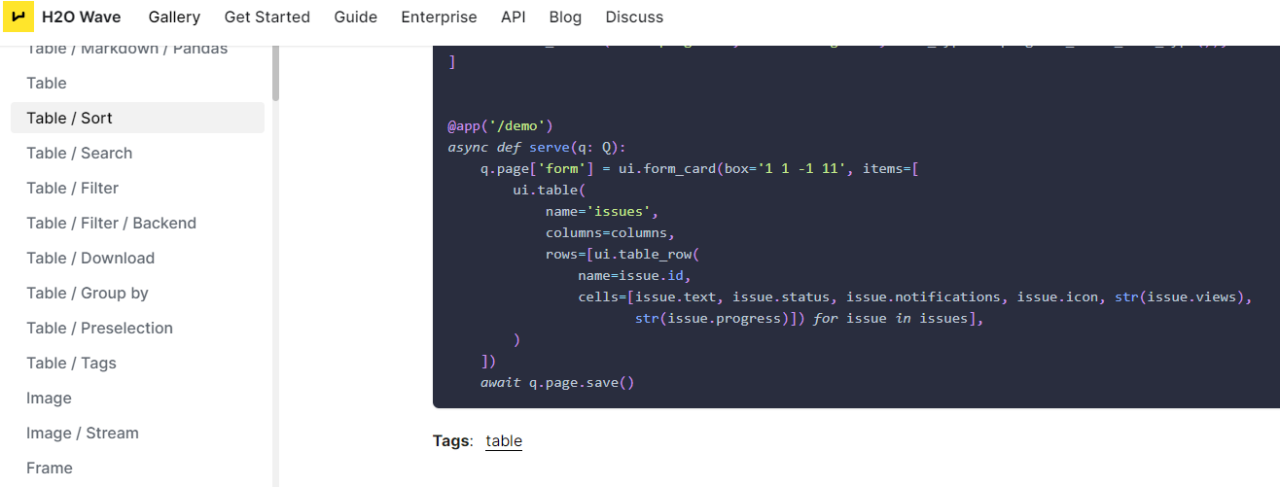
Again, we create a new df_top_songs data frame to store the relevant information. We can add another ui.form_card like the previous example and use the q.page.add method to add this new form card to our page. In ui.form_card, we can also add a ui. table object to show the table.
Running the App Locally
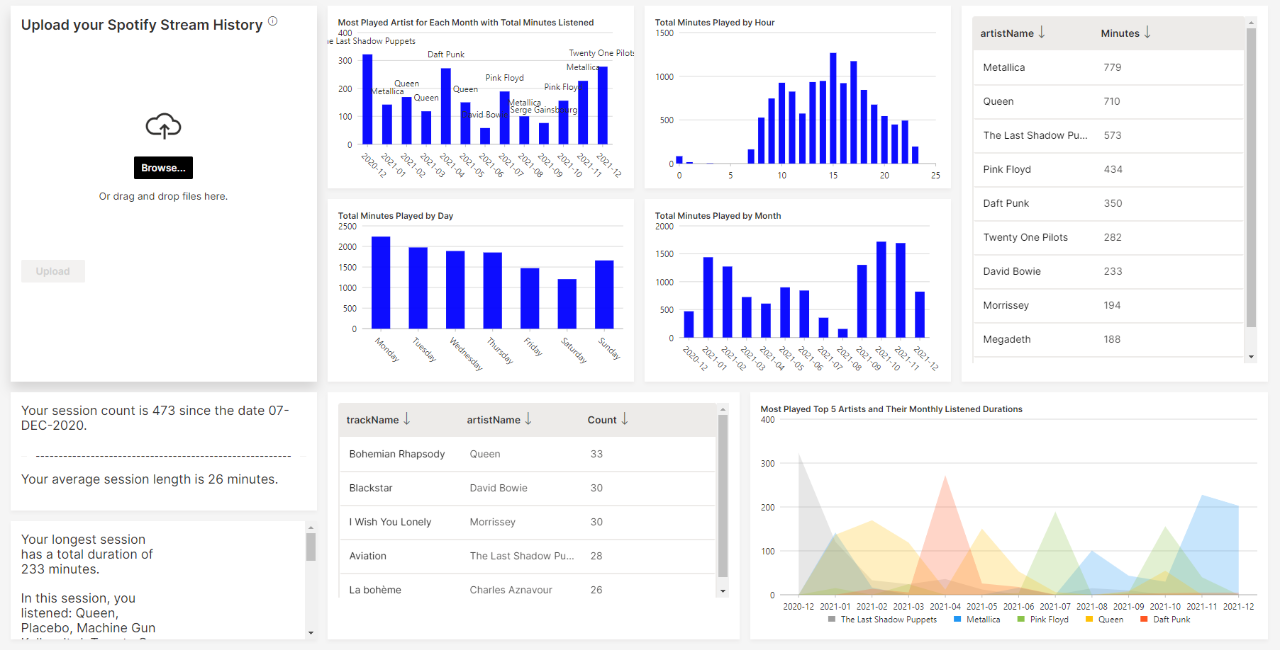
You can continue to add more cards to the page as shown below. When you are done with the python script (e.g. spotify_app.py), you can start the app with wave run spotify_app in terminal and visit http://localhost:10101/spotify in browser.
Spotify EDA App
Wave App Deployment
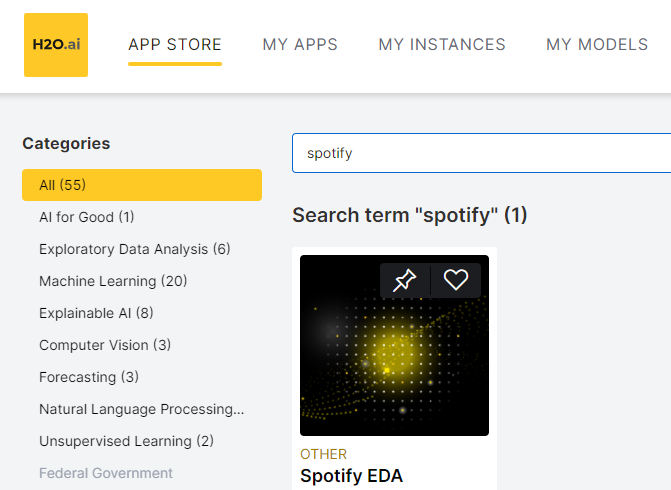
Ready to give it a try? H2O AI Cloud provides a user-friendly, one-stop service for hosting Wave apps. I have uploaded the app to H2O AI Cloud. You can find the Spotify app from “App Store”.
Spotify EDA App on H2O AI Cloud
You can also upload your own Wave app to the “App Store”. First, you will need to package the Wave app into a zip file. Check out this video for more information.
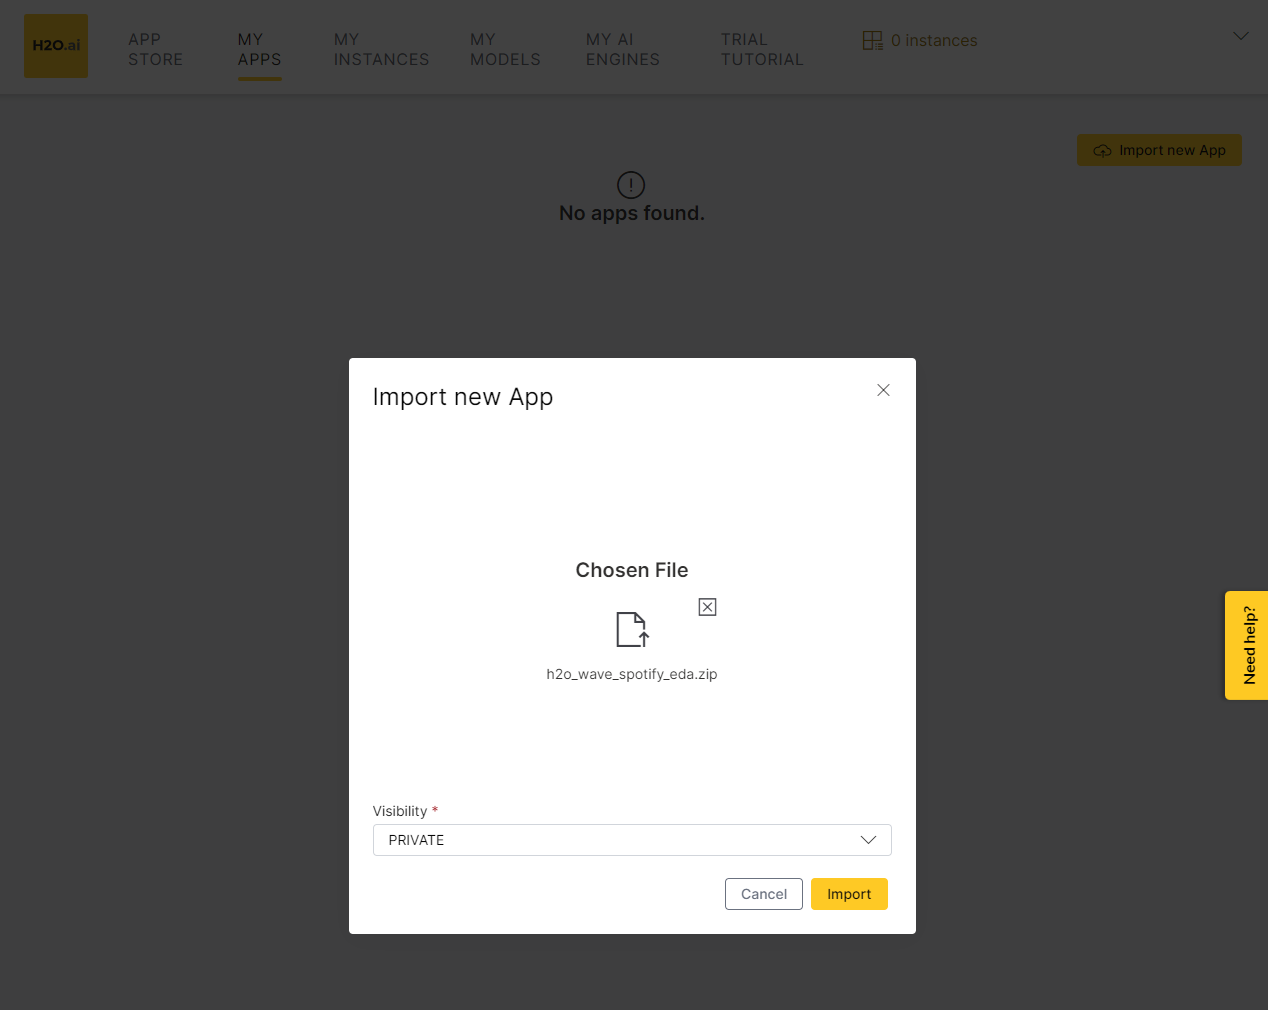
For this Spotify app example, I have already prepared the zip file so you can just download h2o_wave_spotify_eda.zip from this GitHub repository and import the app as shown below. You can also find the source code from the same repository.
H2O AI Cloud → My Apps → Import new App
You can also change the app visibility (private/public) with just a few clicks
Shortly after that, you will be able to visit the Spotify EDA app from “My Apps”.
That’s it. I hope you find this tutorial useful. Request a demo today to get a hands-on experience.