


Today, I would like to cover the most basic use case for H2O Wave, which is collecting a bunch of data and displaying them in a nice and clean way. The goal is to build a simple dashboard that shows how H2O Wave compares against its main competitors in terms of popularity and codebase metrics. The main competitors in question are:
We will build a Wave script that gathers public data from Github, StackOverflow, and Twitter using GraphQL, HTTPX, and python asyncio.
Basic project setup
- Create an empty directory.
- Create a script.py file.
- Create and activate a Python virtual environment (python3 -m venv venv && source venv/bin/activate).
- Install H2O Wave (pip install h2o-wave).
Afterward, let’s write some very basic setup code.
# Imports that we will eventually need.
import collections
from asyncio import ensure_future, gather, get_event_loop
from h2o_wave import data, site, ui
from httpx import AsyncClient
# Register page at "/" route.
page = site['/']
# Setup layout.
page['meta'] = ui.meta_card(
box='',
title='Wave comparison',
layouts=[
ui.layout(breakpoint='xs', zones=[
ui.zone(name='header'),
ui.zone(name='intro', direction=ui.ZoneDirection.ROW, size='500px'),
ui.zone(name='plots1', direction=ui.ZoneDirection.ROW, size='300px'),
ui.zone(name='plots2', direction=ui.ZoneDirection.ROW, size='300px'),
]),
])
# Render header.
page['header'] = ui.header_card(
box='header',
title='Wave competition comparison',
subtitle="Let's see how well Wave does against its rivals.",
image='https://wave.h2o.ai/img/h2o-logo.svg',
)
page.save()
Basic project scaffolding.
For the script to run, we need to have a Wave server already running and then simply run python script.py within our activated virtual env.
Why script and not an app?
The reason is simple: We don’t need user interactions. All we want is to just display data in a nice readable way. This also makes it cheaper to run in production and easier to maintain as data updates do not require restarts in comparison to an app. For more detailed info check the official documentation on apps and scripts.
Authentication tokens
For this project, we will need 2 things, necessary to communicate with API endpoints:
- Github personal access token (see obtaining instructions).
- Twitter bearer token (see obtaining instructions).
When done, to keep things simple, let’s just set them as variables. IMPORTANT: Do not commit them to your repo. If you wish so, rewrite them to environment variables instead.
# TODO: Fill with yours.
GH_TOKEN = ''
TWITTER_BEARER_TOKEN = ''
Setting the tokens.
GraphQL query
GraphQL is a somewhat new alternative to traditional REST API. The main advantage it offers is that you can query the data and handpick only those parts that you need instead of getting full data that you may not use anyway.
Let’s define our query that should get us some interesting data about the Github repositories in question:
graphql_query = """
fragment repoFields on Repository {
createdAt
description
forkCount
homepageUrl
openGraphImageUrl
stargazerCount
licenseInfo {
name
}
vulnerabilityAlerts {
totalCount
}
watchers {
totalCount
}
latestRelease {
createdAt
}
}
{
Wave: repository(name: "wave", owner: "h2oai") {
...repoFields
}
Streamlit: repository(name: "streamlit", owner: "streamlit") {
...repoFields
}
Dash: repository(name: "dash", owner: "plotly") {
...repoFields
}
Shiny: repository(name: "shiny", owner: "rstudio") {
...repoFields
}
}
"""
GraphQL query.
Let’s break down the query. The first thing to note is fragment definition. This is just a piece of reusable blueprint to save ourselves from manual copy-pasting it for all 4 repositories. Inside, we specify what data (fields) we are interested in. You can browse the whole Github GraphQL schema to explore all the possibilities it offers.
The second part consists of actual queries for the 4 repositories we want to compare. The nice thing about GraphQL is that it allows you to get the needed data in a single request whereas it would take 4 separate ones (one for each repo) compared to the REST approach.
Data fetching
H2O Wave comes with an HTTP client library called HTTPX as its own dependency so let’s take advantage of that and use it as well — no additional installation is needed.
First, we need to define helper functions for data fetching from the designated data sources.
def fill_github_issues(client, framework, repo, org, data, query):
query += f' repo:{org}/{repo}'
open_issues = client.get(
url=f'https://api.github.com/search/issues',
params={'q': f'{query} is:open'},
headers={'Authorization': 'Bearer ' + GH_TOKEN}
)
closed_issues = client.get(
url=f'https://api.github.com/search/issues',
params={'q': f'{query} is:closed'},
headers={'Authorization': 'Bearer ' + GH_TOKEN}
)
# Fill the provided data dict for later consumption.
data['bugs'].append([framework, 'open', open_issues.json()['total_count']])
data['bugs'].append([framework, 'closed', closed_issues.json()['total_count']])
def fill_github_data(client, data):
# Make an HTTP Post request with JSON containing our GraphQL query.
res = client.post(
url='https://api.github.com/graphql',
headers={'Authorization': 'Bearer ' + GH_TOKEN},
json={'query': graphql_query}
)
# Unpack the response.
data['github_data'] = res.json()['data']
# Fill the provided data dict for later consumption.
for name, metadata in data['github_data'].items():
data['vulnerabilities'].append([name, metadata['vulnerabilityAlerts']['totalCount']])
data['watchers'].append([name, metadata['watchers']['totalCount']])
data['stars'].append([name, metadata['stargazerCount']])
def fill_twitter_data(client, framework, data):
res = client.get(
url='https://api.twitter.com/2/tweets/counts/recent',
headers={'Authorization': 'Bearer ' + TWITTER_BEARER_TOKEN},
params={'query': framework}
)
# Fill the provided data dict for later consumption.
data['twitter_data'].append([framework, res.json()['meta']['total_tweet_count']])
def fill_stackoverflow_data(client, tag, data):
res = client.get(f'https://api.stackexchange.com/2.2/tags?inname={tag}&site=stackoverflow')
# Fill the provided data dict for later consumption.
data['so_data'].append([tag, res.json()['items'][0]['count']])
Fetching helper functions.
All the functions get client parameter which is an HTTP client instance (more on that in the next section) to allow making HTTP requests. The second common parameter is data which is a dictionary to aggregate all the fetched data for later display.
In order to gain performance and maintenance benefits, we use httpx.Client.
# Fetch data.
plot_data = collections.defaultdict(list)
with Client() as client:
label_query = 'is:issue label:bug'
title_query = 'bug in:title'
fill_github_data(client, plot_data),
fill_github_issues(client, 'H2O Wave', 'wave', 'h2oai', plot_data, label_query),
fill_github_issues(client, 'Streamlit', 'streamlit', 'streamlit', plot_data, label_query),
fill_github_issues(client, 'Plotly Dash', 'dash', 'plotly', plot_data, title_query),
fill_github_issues(client, 'R Shiny', 'shiny', 'rstudio', plot_data, 'bug'),
fill_twitter_data(client, 'H2O Wave', plot_data),
fill_twitter_data(client, 'Streamlit', plot_data),
fill_twitter_data(client, 'Plotly Dash', plot_data),
fill_twitter_data(client, 'R Shiny', plot_data),
fill_stackoverflow_data(client, 'h2o-wave', plot_data),
fill_stackoverflow_data(client, 'streamlit', plot_data),
fill_stackoverflow_data(client, 'plotly-dash', plot_data),
fill_stackoverflow_data(client, 'shiny', plot_data),
Synchronous fetching.
So far so good. The code is simple and easy to reason about. We fetch the data one by one. The whole data fetching takes around 6.5 seconds. Since we are creating a static dashboard where data are fetched just once, it’s not a big deal, but let’s learn how to optimize for cases when performance matters.
Asyncio to the rescue, a library that brings concurrency model to Python. The main bottleneck of our code is that request 2 does not start until request 1 is finished and so on (request chaining). This would only be valid if requests depended on each other, but they don’t. What we want to do instead is start all the requests simultaneously (without waiting) and only wait until they are all finished.
Firstly, we need to wrap all the Wave script code into an async function, let’s call it main. Then, we need to run the main function in a so-called event loop to take advantage of concurrency.
async def main():
# Register page at "/" route.
page = site['/']
# Setup layout.
page['meta'] = ui.meta_card(
box='',
title='Wave comparison',
layouts=[
ui.layout(breakpoint='xs', zones=[
ui.zone(name='header'),
ui.zone(name='intro', direction=ui.ZoneDirection.ROW, size='500px'),
ui.zone(name='plots1', direction=ui.ZoneDirection.ROW, size='300px'),
ui.zone(name='plots2', direction=ui.ZoneDirection.ROW, size='300px'),
]),
])
# Render header.
page['header'] = ui.header_card(
box='header',
title='Wave competition comparison',
subtitle="Let's see how well Wave does against its rivals.",
image='https://wave.h2o.ai/img/h2o-logo.svg',
)
page.save()
# Run within asyncio event loop to allow concurrent HTTP calls.
loop = get_event_loop()
loop.run_until_complete(main())
Run the Wave script within the event loop.
Then convert all helper data fetching functions to async/await as well.
async def fill_github_issues(client: AsyncClient, framework, repo, org, data, query):
query += f' repo:{org}/{repo}'
# Use gather to make parallel calls and wait until both are complete.
open_issues, closed_issues = await gather(
client.get(
url=f'https://api.github.com/search/issues',
params={'q': f'{query} is:open'},
headers={'Authorization': 'Bearer ' + GH_TOKEN}
),
client.get(
url=f'https://api.github.com/search/issues',
params={'q': f'{query} is:closed'},
headers={'Authorization': 'Bearer ' + GH_TOKEN}
),
)
data['bugs'].append([framework, 'open', open_issues.json()['total_count']])
data['bugs'].append([framework, 'closed', closed_issues.json()['total_count']])
async def fill_github_data(client: AsyncClient, data):
# Make an HTTP Post request with JSON containing our query.
res = await client.post(
url='https://api.github.com/graphql',
headers={'Authorization': 'Bearer ' + GH_TOKEN},
json={'query': graphql_query}
)
# Unpack the response.
data['github_data'] = res.json()['data']
# Fill the provided data dict for later consumption.
for name, metadata in data['github_data'].items():
data['vulnerabilities'].append([name, metadata['vulnerabilityAlerts']['totalCount']])
data['watchers'].append([name, metadata['watchers']['totalCount']])
data['stars'].append([name, metadata['stargazerCount']])
async def fill_twitter_data(client: AsyncClient, framework, data):
res = await client.get(
url='https://api.twitter.com/2/tweets/counts/recent',
headers={'Authorization': 'Bearer ' + TWITTER_BEARER_TOKEN},
params={'query': framework}
)
data['twitter_data'].append([framework, res.json()['meta']['total_tweet_count']])
async def fill_stackoverflow_data(client: AsyncClient, tag, data):
res = await client.get(f'https://api.stackexchange.com/2.2/tags?inname={tag}&site=stackoverflow')
data['so_data'].append([tag, res.json()['items'][0]['count']])
Convert fetching functions into async/await.
The last remaining thing is to call all the functions. For that, we first need to understand 2 asyncio functions.
- asyncio.ensure_future = wraps coroutine (async function in our case) and returns a python Future object, which is basically kind of a “promise” that the function will resolve at some later point (in the future). For Javascript developers, this is the equivalent of promise.
- asyncio.gather = helper function that takes a list of futures and resolves once they are all resolved. Also returns a future itself.
Equipped with this knowledge, we are ready for the final concurrent data fetching code.
# Fetch data.
plot_data = collections.defaultdict(list)
async with AsyncClient() as client:
label_query = 'is:issue label:bug'
title_query = 'bug in:title'
# Wait until all requests have been fulfilled.
await gather(
ensure_future(fill_github_data(client, plot_data)),
ensure_future(fill_github_issues(client, 'H2O Wave', 'wave', 'h2oai', plot_data, label_query)),
ensure_future(fill_github_issues(client, 'Streamlit', 'streamlit', 'streamlit', plot_data, label_query)),
ensure_future(fill_github_issues(client, 'Plotly Dash', 'dash', 'plotly', plot_data, title_query)),
ensure_future(fill_github_issues(client, 'R Shiny', 'shiny', 'rstudio', plot_data, 'bug')),
ensure_future(fill_twitter_data(client, 'H2O Wave', plot_data)),
ensure_future(fill_twitter_data(client, 'Streamlit', plot_data)),
ensure_future(fill_twitter_data(client, 'Plotly Dash', plot_data)),
ensure_future(fill_twitter_data(client, 'R Shiny', plot_data)),
ensure_future(fill_stackoverflow_data(client, 'h2o-wave', plot_data)),
ensure_future(fill_stackoverflow_data(client, 'streamlit', plot_data)),
ensure_future(fill_stackoverflow_data(client, 'plotly-dash', plot_data)),
ensure_future(fill_stackoverflow_data(client, 'shiny', plot_data)),
)
Fetching data concurrently.
The async code now fetches all the data in around 0.8 seconds which is an 8x performance increase. Not bad at all ![]()
Display the data
The hardest part is done, let’s unleash the power of H2O Wave and see how simple it actually is to create the dashboard (spoiler: < 80 lines of code).
# Render overview cards for every framework.
for name, metadata in plot_data['github_data'].items():
latest_release = None
if metadata['latestRelease'] != None:
latest_release = metadata['latestRelease']['createdAt']
page[f'overview-{name}'] = ui.tall_article_preview_card(
box=ui.box('intro', width='25%'),
title=name,
subtitle=metadata['licenseInfo']['name'],
image=metadata['openGraphImageUrl'],
content=f"""
{metadata['description']}
</br></br>
**Created**: {metadata['createdAt'].split('T')[0]}
</br>
**Last release**: {latest_release.split('T')[0] if latest_release else 'Unknown'}
</br>
**Homepage**: {metadata['homepageUrl']}
"""
)
# Render plots.
page['bugs'] = ui.plot_card(
box=ui.box('plots1', width='25%', order=1),
title='Bugs',
data=data('framework state bugs', 4, rows=plot_data['bugs'], pack=True),
plot=ui.plot([
ui.mark(type='interval', x='=framework', y='=bugs',
color='=state', dodge='auto', color_range='$red $green', y_min=0)
])
)
page['watchers'] = ui.plot_card(
box=ui.box('plots1', width='25%', order=2),
title='Watchers',
data=data('framework watchers', 4, rows=plot_data['watchers'], pack=True),
plot=ui.plot([
ui.mark(type='interval', x='=framework', y='=watchers', y_min=0,
fill_color='$green')
])
)
page['stars'] = ui.plot_card(
box=ui.box('plots1', width='25%', order=3),
title='Stars',
data=data('framework stars', 4, rows=plot_data['stars'], pack=True),
plot=ui.plot([
ui.mark(type='interval', x='=framework', y='=stars', y_min=0,
fill_color='$yellow')
])
)
page['vulnerabilities'] = ui.plot_card(
box=ui.box('plots1', width='25%', order=4),
title='Vulnerabilities',
data=data('framework vulns', 4, rows=plot_data['vulnerabilities'], pack=True),
plot=ui.plot([
ui.mark(type='interval', x='=framework', y='=vulns', y_min=0)
])
)
page['stackoverflow'] = ui.plot_card(
box='plots2',
title='Stack overflow questions',
data=data('framework questions', 4, rows=plot_data['so_data'], pack=True),
plot=ui.plot([
ui.mark(type='interval', x='=framework', y='=questions', y_min=0,
fill_color='$orange')
])
)
page['twitter'] = ui.plot_card(
box='plots2',
title='Twitter tweets for the past week',
data=data('framework tweets', 4, rows=plot_data['twitter_data'], pack=True),
plot=ui.plot([
ui.mark(type='interval', x='=framework', y='=tweets', y_min=0,
fill_color='$blue')
])
)
Display the data.
Wrapping up
Our full code (± 200 lines of code). Note that you need to obtain auth tokens first (see the Authentication tokens section at the beginning of this post) to run the code successfully.
import collections
from asyncio import ensure_future, gather, get_event_loop
from h2o_wave import data, site, ui
from httpx import AsyncClient
# TODO: Fill with yours.
GH_TOKEN = ''
TWITTER_BEARER_TOKEN = ''
graphql_query = """
fragment repoFields on Repository {
createdAt
description
forkCount
homepageUrl
openGraphImageUrl
stargazerCount
licenseInfo {
name
}
vulnerabilityAlerts {
totalCount
}
watchers {
totalCount
}
latestRelease {
createdAt
}
}
{
Wave: repository(name: "wave", owner: "h2oai") {
...repoFields
}
Streamlit: repository(name: "streamlit", owner: "streamlit") {
...repoFields
}
Dash: repository(name: "dash", owner: "plotly") {
...repoFields
}
Shiny: repository(name: "shiny", owner: "rstudio") {
...repoFields
}
}
"""
async def fill_github_issues(client: AsyncClient, framework, repo, org, data, query):
query += f' repo:{org}/{repo}'
# Use gather to make parallel calls and wait until both are complete.
open_issues, closed_issues = await gather(
client.get(
url=f'https://api.github.com/search/issues',
params={'q': f'{query} is:open'},
headers={'Authorization': 'Bearer ' + GH_TOKEN}
),
client.get(
url=f'https://api.github.com/search/issues',
params={'q': f'{query} is:closed'},
headers={'Authorization': 'Bearer ' + GH_TOKEN}
),
)
data['bugs'].append([framework, 'open', open_issues.json()['total_count']])
data['bugs'].append([framework, 'closed', closed_issues.json()['total_count']])
async def fill_github_data(client, data):
# Make an HTTP Post request with JSON containing our query.
res = await client.post(
url='https://api.github.com/graphql',
headers={'Authorization': 'Bearer ' + GH_TOKEN},
json={'query': graphql_query}
)
# Unpack the response.
data['github_data'] = res.json()['data']
# Fill the provided data dict for later consumption.
for name, metadata in data['github_data'].items():
data['vulnerabilities'].append([name, metadata['vulnerabilityAlerts']['totalCount']])
data['watchers'].append([name, metadata['watchers']['totalCount']])
data['stars'].append([name, metadata['stargazerCount']])
async def fill_twitter_data(client, framework, data):
res = await client.get(
url='https://api.twitter.com/2/tweets/counts/recent',
headers={'Authorization': 'Bearer ' + TWITTER_BEARER_TOKEN},
params={'query': framework}
)
data['twitter_data'].append([framework, res.json()['meta']['total_tweet_count']])
async def fill_stackoverflow_data(client, tag, data):
res = await client.get(f'https://api.stackexchange.com/2.2/tags?inname={tag}&site=stackoverflow')
data['so_data'].append([tag, res.json()['items'][0]['count']])
# Register page at "/" route.
page = site['/']
async def main():
# Setup layout.
page['meta'] = ui.meta_card(
box='',
title='Wave comparison',
layouts=[
ui.layout(breakpoint='xs', zones=[
ui.zone(name='header'),
ui.zone(name='intro', direction=ui.ZoneDirection.ROW, size='500px'),
ui.zone(name='plots1', direction=ui.ZoneDirection.ROW, size='300px'),
ui.zone(name='plots2', direction=ui.ZoneDirection.ROW, size='300px'),
]),
])
# Render header.
page['header'] = ui.header_card(
box='header',
title='Wave competition comparison',
subtitle="Let's see how well Wave does against its rivals.",
image='https://wave.h2o.ai/img/h2o-logo.svg',
)
# Fetch data.
plot_data = collections.defaultdict(list)
async with AsyncClient() as client:
label_query = 'is:issue label:bug'
title_query = 'bug in:title'
await gather(
ensure_future(fill_github_data(client, plot_data)),
ensure_future(fill_github_issues(client, 'H2O Wave', 'wave', 'h2oai', plot_data, label_query)),
ensure_future(fill_github_issues(client, 'Streamlit', 'streamlit', 'streamlit', plot_data, label_query)),
ensure_future(fill_github_issues(client, 'Plotly Dash', 'dash', 'plotly', plot_data, title_query)),
ensure_future(fill_github_issues(client, 'R Shiny', 'shiny', 'rstudio', plot_data, 'bug')),
ensure_future(fill_twitter_data(client, 'H2O Wave', plot_data)),
ensure_future(fill_twitter_data(client, 'Streamlit', plot_data)),
ensure_future(fill_twitter_data(client, 'Plotly Dash', plot_data)),
ensure_future(fill_twitter_data(client, 'R Shiny', plot_data)),
ensure_future(fill_stackoverflow_data(client, 'h2o-wave', plot_data)),
ensure_future(fill_stackoverflow_data(client, 'streamlit', plot_data)),
ensure_future(fill_stackoverflow_data(client, 'plotly-dash', plot_data)),
ensure_future(fill_stackoverflow_data(client, 'shiny', plot_data)),
)
# Render overview cards for every framework.
for name, metadata in plot_data['github_data'].items():
latest_release = None
if metadata['latestRelease'] != None:
latest_release = metadata['latestRelease']['createdAt']
page[f'overview-{name}'] = ui.tall_article_preview_card(
box=ui.box('intro', width='25%'),
title=name,
subtitle=metadata['licenseInfo']['name'],
image=metadata['openGraphImageUrl'],
content=f"""
{metadata['description']}
</br></br>
**Created**: {metadata['createdAt'].split('T')[0]}
</br>
**Last release**: {latest_release.split('T')[0] if latest_release else 'Unknown'}
</br>
**Homepage**: {metadata['homepageUrl']}
"""
)
# Render plots.
page['bugs'] = ui.plot_card(
box=ui.box('plots1', width='25%', order=1),
title='Bugs',
data=data('framework state bugs', 4, rows=plot_data['bugs'], pack=True),
plot=ui.plot([
ui.mark(type='interval', x='=framework', y='=bugs',
color='=state', dodge='auto', color_range='$red $green', y_min=0)
])
)
page['watchers'] = ui.plot_card(
box=ui.box('plots1', width='25%', order=2),
title='Watchers',
data=data('framework watchers', 4, rows=plot_data['watchers'], pack=True),
plot=ui.plot([
ui.mark(type='interval', x='=framework', y='=watchers', y_min=0,
fill_color='$green')
])
)
page['stars'] = ui.plot_card(
box=ui.box('plots1', width='25%', order=3),
title='Stars',
data=data('framework stars', 4, rows=plot_data['stars'], pack=True),
plot=ui.plot([
ui.mark(type='interval', x='=framework', y='=stars', y_min=0,
fill_color='$yellow')
])
)
page['vulnerabilities'] = ui.plot_card(
box=ui.box('plots1', width='25%', order=4),
title='Vulnerabilities',
data=data('framework vulns', 4, rows=plot_data['vulnerabilities'], pack=True),
plot=ui.plot([
ui.mark(type='interval', x='=framework', y='=vulns', y_min=0)
])
)
page['stackoverflow'] = ui.plot_card(
box='plots2',
title='Stack overflow questions',
data=data('framework questions', 4, rows=plot_data['so_data'], pack=True),
plot=ui.plot([
ui.mark(type='interval', x='=framework', y='=questions', y_min=0,
fill_color='$orange')
])
)
page['twitter'] = ui.plot_card(
box='plots2',
title='Twitter tweets for the past week',
data=data('framework tweets', 4, rows=plot_data['twitter_data'], pack=True),
plot=ui.plot([
ui.mark(type='interval', x='=framework', y='=tweets', y_min=0,
fill_color='$blue')
])
)
page.save()
# Run within asyncio event loop to allow concurrent HTTP calls.
loop = get_event_loop()
loop.run_until_complete(main())
Full code.
That after rendering should result in.
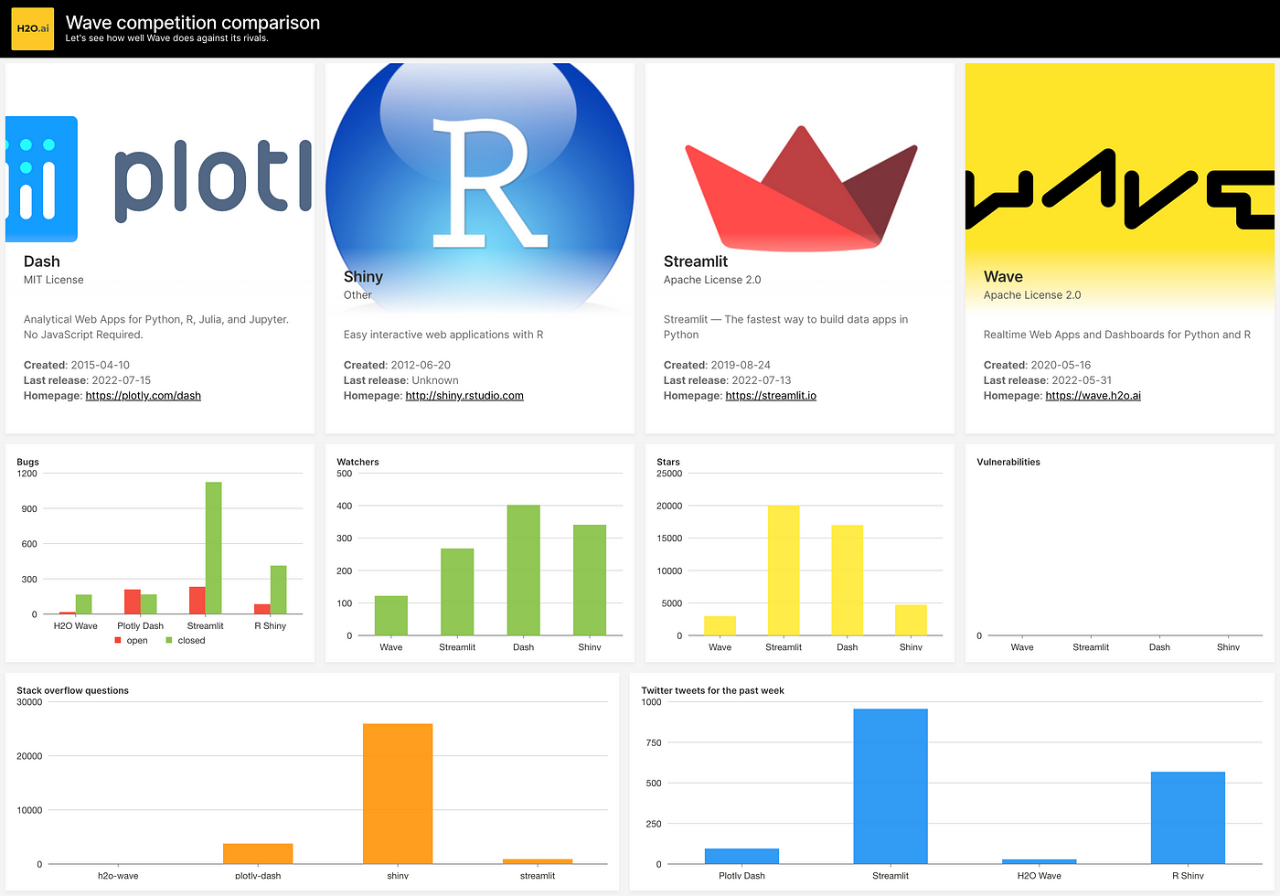
Final dashboard.
As you can see, H2O Wave is still lacking in popularity so asking questions on StackOverflow, and showing off your apps/scripts on Twitter or other social media networks is highly appreciated!