


H2O Driverless AI Demo
Watch this end-to-end demo of H2O Driverless AI.
This demo includes:
- Data Visualization
- An AI experiment
- Machine Learning Interpretability
- One-click deployment
- Bring Your Own Recipe
This demo gives you the perfect overview in just over 6 minutes!
Read the Full Transcript
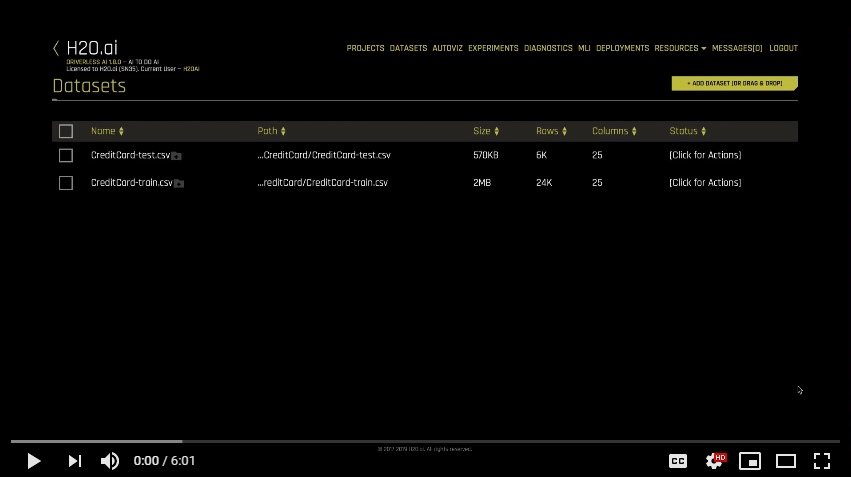
Welcome to Driverless AI, an automated machine learning platform, which can run in any major cloud or on premise. Driverless AI specifically helps with supervised machine learning, that is use cases where we historically know what happened and can learn from this to make predictions about the future. To load in data, we’ll use the Add Dataset button. We have many connectors to common data stores, including a JDBC connector for most any SQL data warehouse. Using the configuration file, we can add in any necessary credentials to connect to our data stores. After loading in a dataset, we can view it using the Details option. This will show us information about every column in our dataset, including distributions and data type. We can also change the data type if we need to.
To continue exploring our dataset, we’ll next select Visualize, which will build standard statistical visualizations on every column in combination of columns, and then return back to us the interesting ones. Here, we can see interesting correlations and every column in our dataset that has any outliers. Driverless AI can automatically handle missing values and outliers while modeling, but it’s good to check and see that our data really is as clean as possible. Before we begin modeling, we may want to split up our data into training and testing datasets. Driverless AI will automatically do cross validation to ensure we’re not over-fitting while modeling, but it’s good to have pull out data to see how our model does on data that it’s never seen before. We can do stratified splitting to make sure that rare classification events are appropriately split between both datasets. Or we can do time-based splitting to create one data set on the past and another data set on future.
We’re now ready to kick off our auto ML. Remember that Driverless AI is for supervised machine learning. So the only thing we have to do is tell it which column we want to predict. At this point, many default settings have been selected for us. We might want to change the experiment name and add in our test data set to get automatically scored on once our modeling is complete. On the left hand side, we have an explanation of what all is going to happen when we kick off for experiment. This includes what type of algorithms we’ll use and what types of new features we’ll automatically test out.
By changing the accuracy time and interpretability settings, we can change how complicated or easy to understand the new features will be. This also changes how many rounds of models competing against each other can run, and data science specifics like the amount of cross validation or ensembling that we’ll do. Advanced users may want to explore the Experts Settings, which will give you full control of exactly what will happen in the experiment. Finally, we may want to change the metric that our model’s optimizing for, to best suit our business use case. And now, we’re ready to launch our experiment.
The wheel at the top will tell us exactly what Driverless is currently doing. At the bottom, we’ll see notifications about our data, like if any columns are unique IDs that are automatically dropped, or if any features are suspiciously too predictive. While our experiment is running, we can see the models that are currently competing against each other. We can see which features are most important in each model, including new engineered features. And we can see metrics about how our model is doing on the validation data. These settings and the dataset will take about four minutes to run. We’ll jump now to a completed experiment. In the summary, we can see how many new features were tested and how many total models [inaudible 00:03:52]. We can download a report, which documents our experiment. Which models did we try? What worked? What didn’t work? What was our modeling methodology? And so forth.
The sections here are based off of what data scientists typically have to document at the end of their projects. We can next go to the machine learning interpretability module to understand how our model makes decisions. Here, shop values tell us which features contributed the most to our model predictions, both globally, and positive and negative values for each individual row. Partial dependency plots tell us what about a specific feature is important to our model. And disparate impact analysis gives us insight, and if our model is biased, we’re treating some groups of people unfairly. We also have surrogate models, like line and a decision tree to help us understand how our model is making decisions. Going back to our experiment, we may want to productionalize our final model. We can do this in a Python environment using the Python scoring pipeline, which downloads a wheel file, or we can use the Mojo for Java, C++, or our environments.
This is a production ready artifact that does the automatic feature engineering and gives you a score. This allows you to use our model as a REST server and a Java API, or wherever else you need to, for real time scoring or batch processing. We also have one-click deployment options to Amazon Lambda or a local REST server. When working on the use case, you may want to group together experiments using the Projects tab. This allows you to compare different experiments, which may be built on the same data, but have different settings. Finally, today, we demoed out of the box Driverless AI, but this platform is fully extensible to the models, data transformations, and scoring metrics that you need for your business use case. These can be added in as Python snippets. To learn more, please check out the Custom Recipe section of our documentation. Thanks for your time today.