


Using Google Analytics for Data-Driven Marketing - Dan Stone
Dan Stone, Product Manager at Google Analytics. H2O World 2015, Day 2 Join the Movement: open source machine learning software from H2O.ai, go to Github repository https://github.com/h2oai
Talking Points:
- Remarketing
- How Google Analytics Works
- Audiences Available in Google Analytics
- Client Example: Online Travel Agency
- Client Example: Telecom
- Powerful Signals
- Predicting Conversions in Google Analytics
- Feature Analysis
- Model Evaluation
- Optimizing On Value
- How Much of This is Available Right Now?
- Attribution Modeling
- Incremental Model Update
- Logical Regression
- Feature Selection
Speakers:
Dan Stone, Product Manager, Google
Nima Asharbeygi, Tech Lead, Google
Read the Full Transcript
Dan Stone:
All right. Well, I am Dan Stone. I'm a product manager on the Google Analytics team, focused on our user-centric analytics and some of our audience marketing integrations.
Nima Asgharbeygi:
My name is Nima. I'm a tech lead on the Google Analytics team.
Dan Stone:
Today we were going to talk about some cases of how the analytics and marketing worlds are colliding, what some of the more advanced advertisers are doing to take advantage of the rich data that they're using in Google Analytics, and deliver better experiences for their users through their marketing activities. All right, let's try this again. In addition to talking about what some of our customers are doing that are really really interesting use cases, we'll also be touching on some of the things that we are doing to try to make this process more approachable for less sophisticated marketers. To be able to take advantage of these same techniques. Compared to some of the other sessions that you've sat through today, we're going to be more focused on the real world use cases of some of this data, and probably less into the deep diving on the data science behind it.
Before we get started, how many of you work with marketing in your day-to-day activities? Great and how many of you use customer demographics or behavior data to try to predict or in some way influence marketing behavior for end customers? Great and how many of you try to do this in real time when these customers are on the way to make a purchase or make an important decision? Only a couple. It's really hard because you have a ton of data and you have information coming from all kinds of different sources. It's really hard to tie together all of the pieces and make this actionable in real time. It's easy to focus on one-off prediction models and figuring out which users are more likely to purchase or turn, but it's much harder to tile these pieces together. What we'll be touching on today is a quick overview of some of the techniques to do this and what some customers are doing. Then, talking about some of the things that we're doing to make this simpler for marketers.
Remarketing
For those of you who might not be as familiar with remarketing, remarketing is a tactic whereby you can use some information about a customer's interaction with your business, whether it's a site or app, and then re-engage with them later on to help drive them toward a decision or an outcome.
Traditionally, it evolved from a very performance driven tactic to help bring users back to your site and convert. Because for every dollar that you spend trying to bring users to your site or to your app, 98% of that value was essentially wasted because only 2% of users typically would convert. As a result, remarketing was a really powerful tactic to allow marketers to plug the leaks in their funnel.
But it evolved from here. From a purely performance based tactic to a tactic that can be used much more creatively to optimize and enhance experiences after a touchpoint with a customer. In addition to helping drive the purchase, some marketers are using this data to be able to follow up with customers after they've purchased, and suggest a video tutorial on how to use the product, or to use the same data and cross sell some of their customers to other products that they might want to buy. This is an example of where we start requiring much more data to do this type of analysis.
How Google Analytics Works
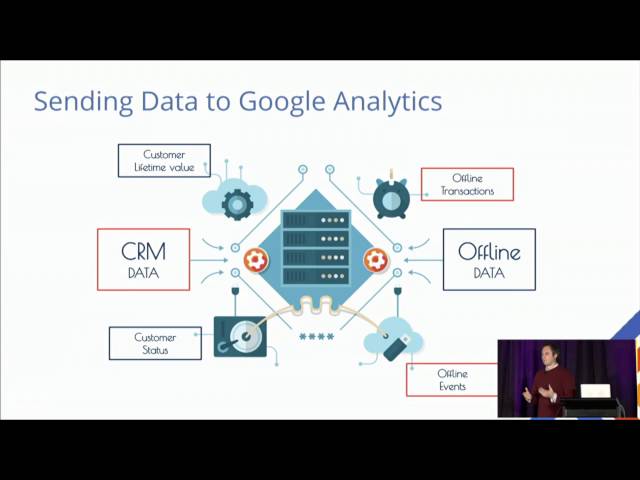
If we zoom out for a second and we think about the types of data that a marketer and many of you are working with on a day-to-day basis. There are all different types. That is one of the reasons why this project is so challenging, is because you have so many different types of data from so many different sources and it's rarely in a consistent format. Just for those who are a little less familiar, we have the main unit of data, which is generally a page view on an advertiser's or a brand's site. This can be tracked in different ways. Generally advertisers will have all the page views tracked using an analytics tag of some kind. They will also be tracking data in their apps and they will be using, what we call measurement protocol, for basically anything else. What are the other things? Sometimes the page view is not the most important action that you want to measure. Sometimes the more important thing is the conversion, the video play, or the cart edition. Whether a user submitted a form. This is tracked through events, quite often with analytics tags, which adds another dimension of data in the system.
An example of how this looks like is you would send an event in the tag that would say this is an event, video, click, play, and perhaps some additional metadata about the event. Another type of information that is often measured is social interactions. Whether someone has interacted with your social share buttons, you can track using the same format. The other type of tracking or measurement is using Enhanced Ecommerce tracking, where you might want to understand how far a user made it through the funnel. Whether they got to a product view, a card edition, internal promotion, checkout, or finally a transaction. This is all done through different code implementations, which adds another dimension to this universe of data. We're just talking about online interactions so far. Beyond what happens online, there are many ways to import custom dimensions and metrics. Things like the customer type or the lifetime value status. As well as metrics like the total number of purchases over a lifetime, or the offline revenue that the user has generated, or even sometimes things as crazy as what temperature it is in the location where the user is coming from. Perhaps you sell more umbrellas on rainy days or during times when there will be rain. What's important is to make sure you have all this data in one system where you can then do the analysis.
Audiences Available in Google Analytics
When we look at it all together, we have over 250 dimensions and metrics that marketers are using right now to try to build better experiences with their users. These cover things from behavior, to events, to eCommerce, where the traffic came from, demographics, and technology. For sophisticated marketers, this means that they have a lot of opportunities to really get fine grained with their audiences.
Client Example: Online Travel Agency
So if we think about the traditional starting point for a lot of marketing. A lot of marketers would start with behavioral funnel stages or conversion stages based on where the user gets to on the site or app. Recently, we had a large online travel agency that had started with behavioral segmentation based on home page, category page, product page views, card abandonment, and then finally past purchasers. What they realized is that two people who were at the exact same point in the conversion journey, let's say the very middle one, where they're at the product page, would actually respond very differently to the offer that was presented. What they later realized is that there were very different segments of their customers that behaved very differently. So they took a step back from this traditional approach, they applied clustering analysis of their customers, and they realized that there was a business traveler segment that behaved very differently that was completely price insensitive and cared more about perks and rewards. So then they reran their models and they realized that there were vastly different decision points for each one of these customer segments versus when they treated all of their customers as a group.
So what they did is the same travel agency took their GA data with all of their custom dimensions, all of their events, and they exported the raw clickstream data through Google BigQuery. They then ran it through their own analytical systems and produced a decision tree for each of those customer segments. That then told them users that had spent more than X time on site and had come from this campaign should have this likelihood to convert. Then they mapped that back into Google Analytics and built audiences that they could then reengage with their users better with.
Client Example: Telecom
One other example is in Telecom. We're seeing this all across the board across verticals. We had an example recently where British Telecom used a similar approach and they were able to achieve vastly lower cost per acquisitions and much higher sales volumes using this approach than what they had previously done. Even when comparing it to their most successful remarketing tactics to date. That's an example of what some really sophisticated marketers are doing today using their analytics data and then mapping it back to actually provide better experiences for their users.
Powerful Signals
Next we want to talk a little bit about what we're trying to do to make this process a lot simpler for the companies that maybe don't have an entire data science team in-house. But I still want to be able to take advantage of some of these tactics for driving performance. If we think back to all these signals that marketers have. In the case of a really advanced customer where they can make use of all this data, it's great. But in some cases too many signals can actually be overwhelming and they can actually hurt. When we also factor in all these other data sources, some marketers don't even know where to start. That's where we tried to help optimize this experience. I'll turn it over to Nima to talk through what we did.
Predicting Conversions in Google Analytics
Nima Asgharbeygi:
Thank you, Dan. To illustrate how we do the training and inference to do prediction for conversion. Here's a very simplified example that shows you a sample of a training set that we take from anonymized visit data from the historical data of a single website. Usually ranging from 30 days to 60 days, or 90 days of theater. Here, as you see in this training set, each row represents one anonymized visit and the middle columns represent some of the features that we use in our modeling algorithms. Things like the origin, the country of origin, the medium keywords, and source. As well as page views. On the rightmost column it is the label that we use. Representing whether there was a conversion at the end of that visit or not. We use this training data to train a logistic regression model and then we use that model to infer the probability of a conversion in near real time. When a new visit comes to this website. Based on the prediction of this probability of conversion, we can then make a decision on whether to target this visitor at this time or not.
Feature Analysis
Now, more realistically, this is a very large scale logistic regression modeling where we use many different features and crosses between these features. We use automatic template exploration to detect the best candidates for feature crosses. We trained a large number of these logistic regression models for many different websites concurrently. Just to illustrate some of these features that come up as important in these models. Here's some examples that you see on the left side. Things like hostname crossed by request_uri, which essentially captures the landing page that the user came into the website from. A few other examples there. Also on the right side it's a plot that shows you a distribution of various feature types that we have across two different dimensions. One being the average weight of the feature across all of the various customer specific models that we have built. Which captures how important, how predictive that feature type is. On the x axis, we have the co-ordinality of the feature. We see that there is a very large range across both of these dimensions and different features have different levels of predictive power in these models.
Model Evaluation
Now, one way that we use to measure the performance of our models is to evaluate them on the historical data that we have on the held out test data to come up with ROC curves such as this. This one is aggregated across all of the customer specific models. What it is showing is the true positive rate for various values of false positive rates. What this means is that based on your operating point, your decision point of what percentage of your traffic you want to target. You can adjust how much of the true conversions you can capture. What we see here is that by targeting only about 10% of the traffic we can cover about, more than 85 to 90 percent of true conversions. Which is a pretty good performance for these models.
This is a really nice result. However, these are models that are built for customers who do have sufficient conversion so that we can build one model for each customer. But we are also interested in helping smaller and medium sized businesses who oftentimes don't have enough conversions or even don't have any conversion tracking. How can we do such a prediction model for them? One idea to address that is to go to a transfer learning paradigm where we train a model on an aggregate training data set from many different customers who do have conversion data. They have opted into data sharing so that this large scale logistic model can capture a variety of patterns and user behaviors across all of these different types of customers. Then applying that generic user model to customers who do not have conversions data. In effect transferring the learned model to these smaller customers. Evaluating this generic user model in a similar way, this is the performance that we get for this model. Which shows it's slightly lower than customer specific models, but still it provides really high value, high predictive power for these customers who wouldn't have this otherwise. Now I give it back to Dan to finish with our thoughts.
Optimizing On Value
Dan Stone:
Sure. We talked today about some of the ways that customers are using their rich data already to build their own decision trees and map that back into their marketing activities. We also touched on one of the ways that we had tried to make this similar tactic available for customers that maybe don't have the sophistication to do this. As we look at where marketers are going, this data is used in concert with their existing bidding strategies, AdWords or other systems. It's complimentary to try to tie into the optimization that they're already doing. A lot of customers started out with ping per click and then were moving to an estimated conversion likelihood baked into that moving toward bidding on conversions or cost per acquisition. In the future bidding toward return on advertising spend or return on value invested. So we're still in very early stages here. We have a lot more to do to make these models better and make it easier for customers to deliver the right experiences to their users at the right time. Thank you. I think we have a couple minutes for our questions. Right there.
How Much of This is Available Right Now?
Audience Member:
First of all, thanks for the great presentation. My main question is, this sounds awesome, but how much of this is actually available in the product right now versus some sort of exploratory work? Because I've been, just through the process of setting up Google Analytics, for what I wanted to make as deep tracking optimization as possible for a certain project and much of this I wish I had right now and I couldn't find.
Dan Stone:
Yeah, that's a good question. The two features that we talked about in the beginning, we mentioned Google BigQuery: which is an integration that is available for all Google Analytics premium clients. If you're a Google Analytics premium, then you should contact your account manager to get access to BigQuery, which basically gives you a really powerful interface for querying raw session level and click level data. In the second part of the presentation, we were talking about these predictive models and they're actually available today as well for everyone. They're called smart lists and they're still in a pilot stage, but they are available for anyone to use.
Audience Member:
Yeah.
Attribution Modeling
Audience Member:
I just wanted to ask a follow up question. What I did not see in this presentation is discussion of attribution modeling. I'm very curious if you could speak to that. What do you currently do with attribution? How it's done, what is a product roadmap for that? And I'm sure many people want to know what it is, so you might want to do the introduction as well.
Dan Stone:
Should I take that?
Nima Asgharbeygi:
Yeah.
Dan Stone:
Okay. For those who couldn't hear it or aren't familiar with the topic, the question was on attribution modeling. I'm probably going to disappoint you because it's a really deep topic. What attribution modeling is it's basically trying to account for the fact that a particular click that goes to a site or an opening of an app may not deserve all of the value from any conversions that result from that particular session. So attribution modeling is an attempt to attribute the value over multiple sessions, touchpoints, or channels. Including online and offline tactics so that the last channel that drove the conversion doesn't get all the credit. This is a really deep area. What we've talked about so far assumes either a simplistic attribution model or that clients are bringing their own attribution model. For more info on various types of attribution, I would suggest you contact someone on the Adometry team which is part of Google. They specialize solely on attribution.
Audience Member:
Okay. Do we have other questions? I think we've got one over here.
Incremental Model Update
Audience Member:
Model update. Incremental model update on your area.
Nima Asgharbeygi:
I'm sorry, I didn't catch it.
Audience Member:
Incremental model.
Audience Member:
Do you model incremental updates?
Nima Asgharbeygi:
Yes. The model update is actually a continuous process, it's a running process that continuously ingests data as it comes in. It does incremental updates every, I believe, every few hours.
Audience Member:
Yes. Thank you. Another question I have is what range of future numbers you are talking about? Is it thousands/millions?
Nima Asgharbeygi:
Feature? Okay. In terms of the order of the number of features that we have. The number of feature types is in the order of hundreds. But the number of feature values would be much larger than that. The specific instances that each feature type can take on. That's a much larger space. I don't have a good range in mind right now to give you, but it might be in the hundreds of thousands.
Audience Member:
But the particular way to deliver on the feature values are the feature types.
Nima Asgharbeygi:
I'm sorry, I didn't catch that.
Audience Member:
So you said two things, feature types.
Nima Asgharbeygi:
Yeah.
Audience Member:
In the feature values.
Nima Asgharbeygi:
Correct.
Audience Member:
I try to understand what is the feature value and the feature type, right? In terms of a weight. Where does the weight live associated with feature values or feature type?
Nima Asgharbeygi:
So the weights are actually associated with feature values. Feature type is one category of a feature such as, for example, page view is the feature type, and then feature values would be the different values that page view can take on like various numbers. Feature page view is equal, one is one feature value equals two is another value. Then in that sense, features are turned into binary features because each feature value becomes a binary feature which is either active or not. Then weights are associated with feature values.
Logical Regression
Audience Member:
Another question I have is you guys doing logistic regression or deep planning. Why are you only doing the logistical regression? Can you share inside of it?
Nima Asgharbeygi:
Ah yes. Currently we are doing logistic regression mainly because it's easier to scale and there are more mature tools for that at least inside Google. We are studying with this and we're getting really good performance on it. We are happy with the performance at the moment, but of course I believe deep learning can give you incremental improvement on the performance but it's just not what you are focusing on right now.
Feature Selection
Audience Member:
Last question, how do you do the feature selection?
Nima Asgharbeygi:
Right. Feature selection is done using a few different methods that do an automatic search in the space of feature crosses using a few different information theoretic criteria that I can't go into the details of, but it is a few information theoretic criteria to select candidates that are likely to be predictive. Now, one thing I'll add to that is that going in, we had hundreds of individual feature categories or dimensions. We were surprised at how few really made a big difference on the order of only a couple dozen. Yeah.
Audience Member:
How do you do the model update? You know, what type of things you are doing to do the model update. Like online model update based on the AOR?
Nima Asgharbeygi:
Well, so I can't share that much detail about how the model update happens. But I believe the way this is done is so every model update actually actually goes over the last, for instance, 30 days of data to retrain the model. But it does leverage the previous convergence points of the model as well. It doesn't start from scratch and you. It starts from the existing convergence point to update the model, but uses more data than just today's data. Yeah. Okay. Great. Let's thank our speakers. Thank you.
6