AI Application to Demonstrate K-Means Clustering Using H2O Wave


Note : this is a community blog post by Shamil Dilshan Prematunga . It was first published on Medium .
In this blog, I am going to highlight how cool H2O Wave is, by demonstrating my application called “K means App” which was built using Wave 0.20.0 . This is a simple application I have created to demonstrate one of the unsupervised learning methods called K-Means Clustering . Let me start with a brief introduction to K-Means Clustering. A cluster is referred to a collection of data points aggregated together because of certain similarities. K value defines the number of centroids within the data points. This algorithm allocates all data points to the particular cluster. The condition here is, it tries to reduce the in-cluster sum of the square value. For that purpose, it will randomly select K number of centroids within the range of data points and repetitively optimize the centroid value until stabilizing the centroid or achieving the defined number of iterations.
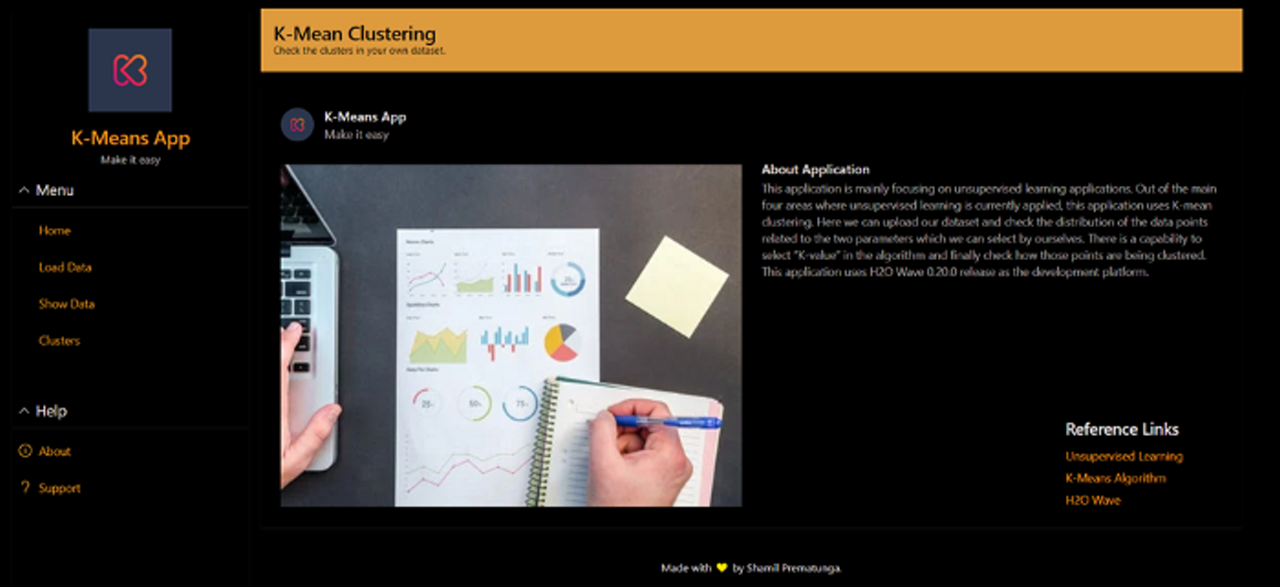
In my application, users can easily get an understanding of the K-Means Clustering algorithm when the home page loads as shown in the below image.
Home Page
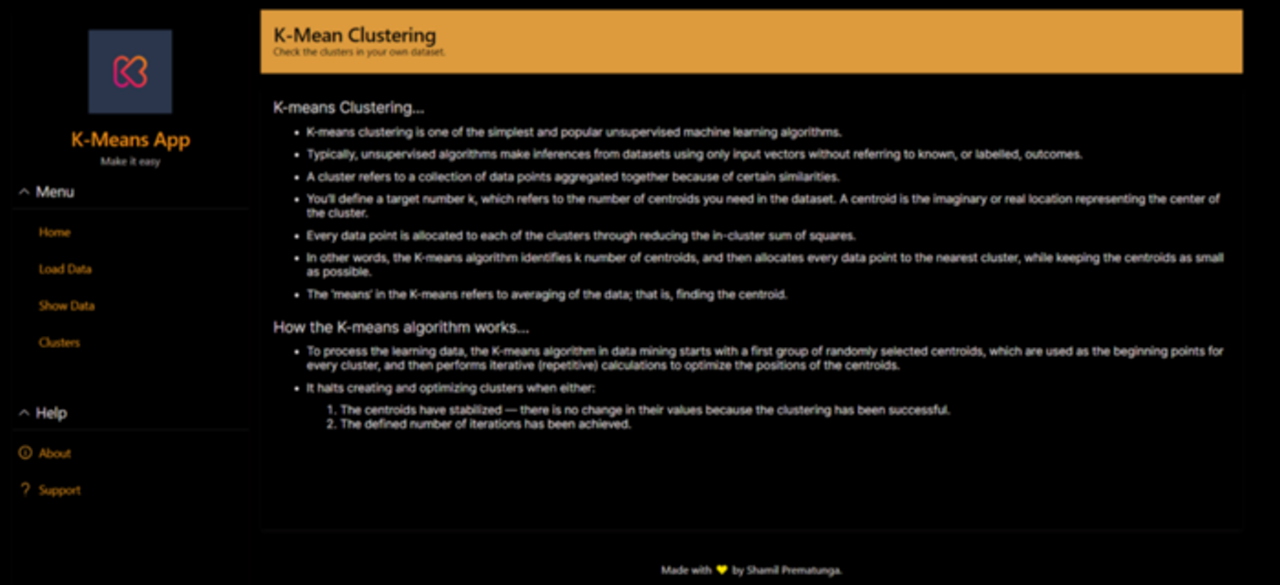

Depending on the scenario the features in the data sets are varying. That is the beauty of this unsupervised learning method. Regarding the scenario, users can check how these data points are distributed, how the clustering happens, and define the meaning for each cluster. That will help in understanding which cluster will be allocated for the new data entry. For a hands-on experience, users can upload their own datasets in CSV format.
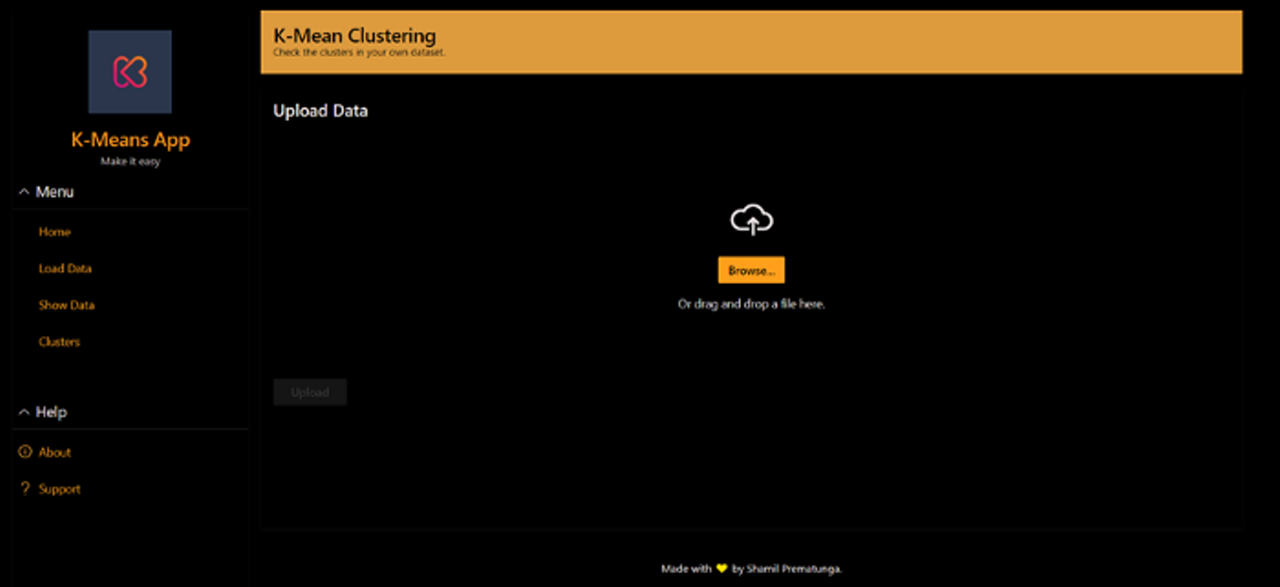
Load Data (Before)

Load Data (After) – Melbourne Housing Market dataset from Kaggle
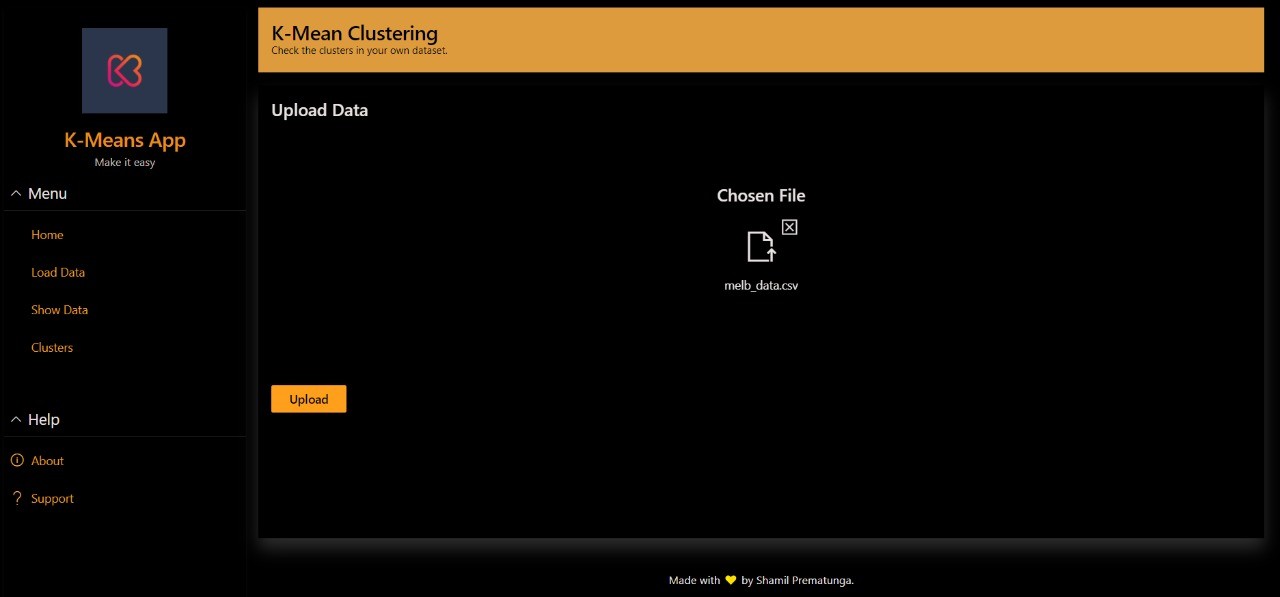

In this application, I filtered numerical columns which can be used to check correlation in between features. I also dropped the data values which are not assigned in the dataset. In this example, I have only selected the first 200 rows of the dataset for the clustering. Before going for a clustering process, users can see a summary of the dataset to get an understanding of the available data and features. The “Show Data” button will do this for the user as shown in the below image.
Show Data
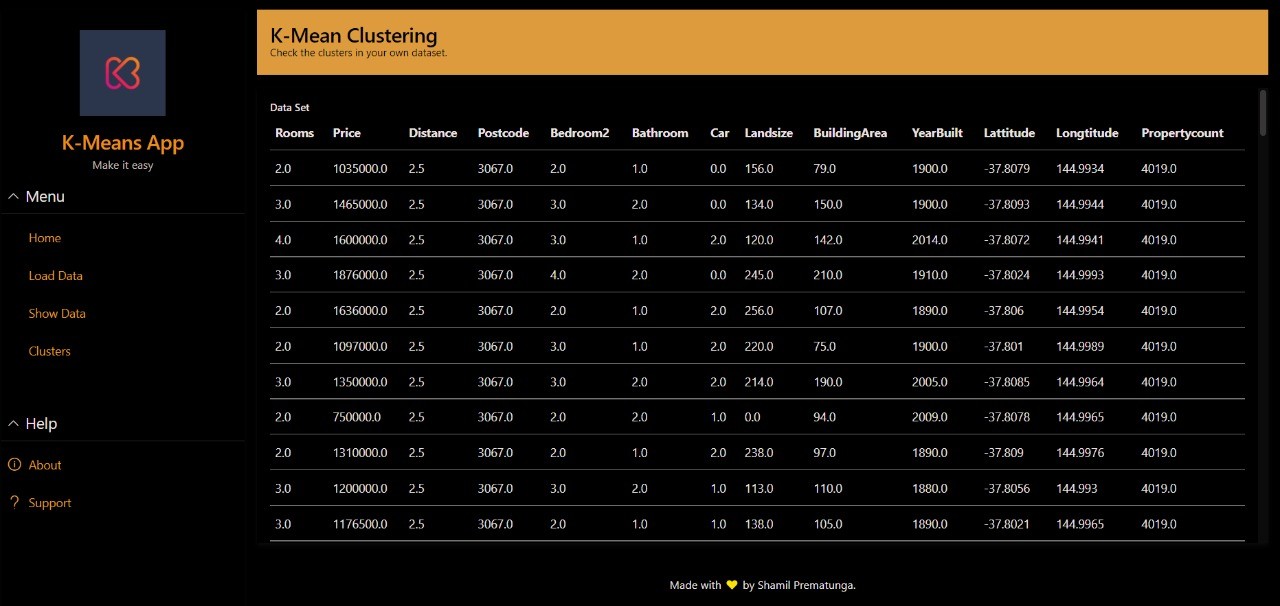

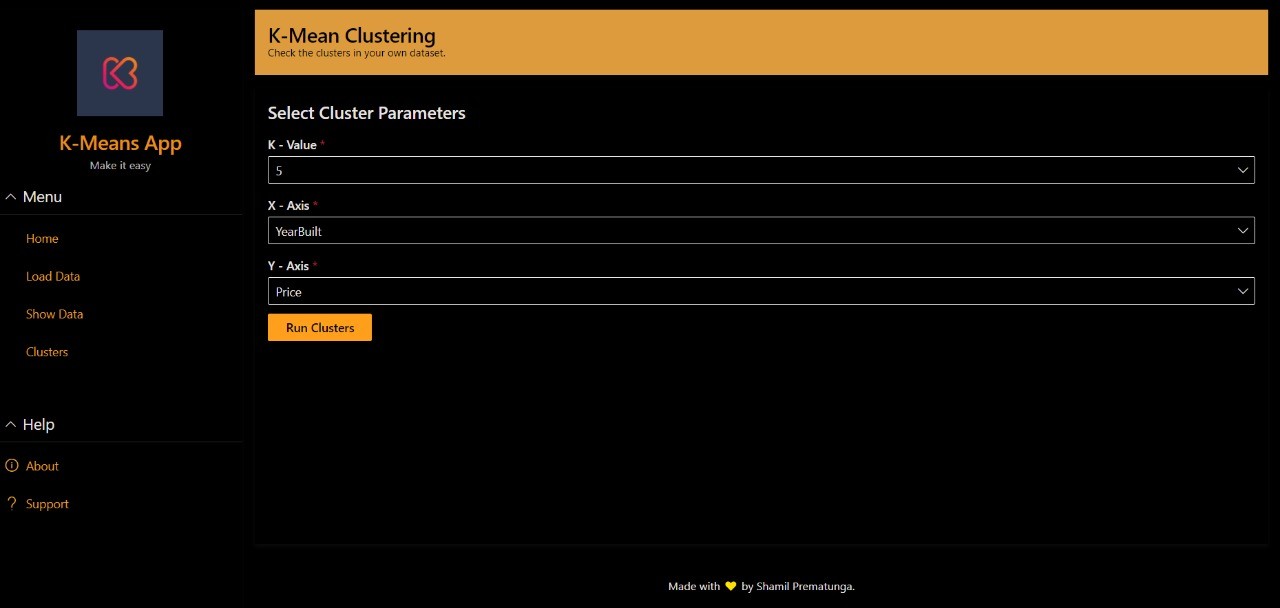
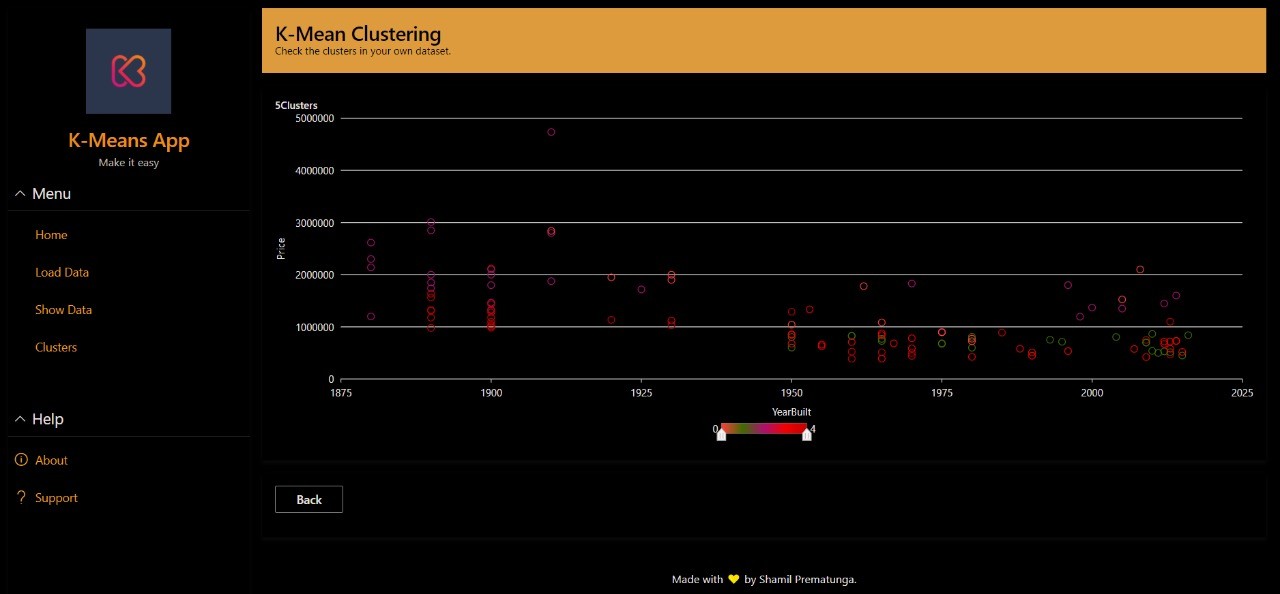
Once the data is ready for clustering, users can fill out the form in the application as needed. In my application, once the user clicks the “Clusters” button, it will load a form to select the K value and what features need to be in the X and Y axes. The speciality of this application is the dropdown values are changing accordingly to the uploaded dataset. After filling out the form and selecting the “Run Clusters” button, it shows a plot of data points in different colors. These colors are representing the clusters identified by the K-Means clustering algorithm. Here I have used KMeans defined in the SKLearn library. I am happy to announce that you can use H2OKMeansEstimator which is in the H2O estimators. This will help users to identify how clusters are derived within the dataset and take further decisions accordingly.
Input Form

Cluster Output

Here I like to highlight the advantages of using H2O Wave. I have used only H2O Wave 0.20.0 to create this end-to-end application. Without the use of HTML or CSS, we can create attractive AI applications with H2O Wave. Rather than explaining the K-Means clustering algorithm to someone in words, it is more worthy to provide this kind of application. It is very easy to build these applications and there is no need to spend much time giving a clear idea to the audience. Within this application, I have used sidebar, footer card, header card, and wide article preview cards to organize the UI. I also used form cards and plot cards to visualize data and contents. Check out some code examples here .


Gradually with each version upgrade, H2O Wave adds new features which are beneficial to both developers who are building applications and clients who are using it to get an understanding of the developers’ approach.
How to Get Started
You can check out the source code here and a demo video of the application. There are also a lot of different Wave apps available on H2O AI Cloud . Sign up for a free demo today.
Wave Apps on H2O AI Cloud


