


GLM Bells and Whistles Part 2: Analysis and Results from Million Songs Data

Using the Million Songs Data we want to characterize a subset of the songs. To do this we’re going to run a binomial regression in H2O’s GLM. The approach to characterizing songs from the 90’s is the same method you can apply to your own data to characterize your customers relative to some larger group. In turn, those findings can be applied to predicting whether a particular individual is likely to become a customer or not.
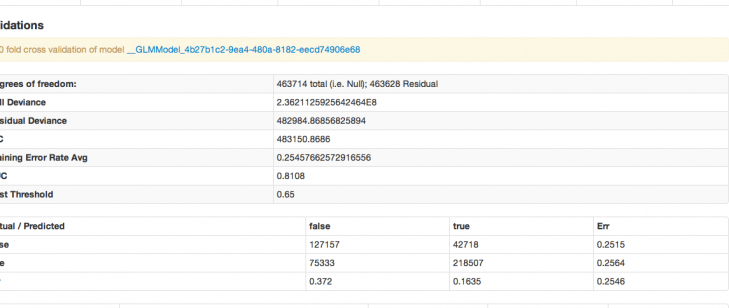
I’ve created a binomial variable such that 1 indicates a song is from the 90’s and 0 otherwise. The DV is binomial, so we specify a binomial family, check that the link function is logit (which it is by default), opt to standardize, and push play. Here are the results:
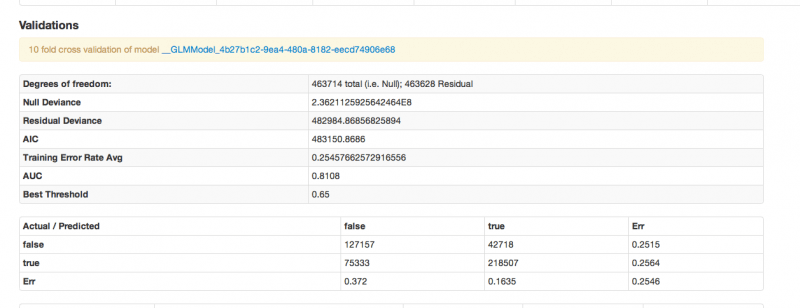
Some quick notes on interpretation
For the degrees of Freedom n is the number of observations (rows), and p is the number of parameters you are estimating.
Null (total) - (n-1) : defined as (n-1) to account for the condition that the residuals must sum to zero.
Residual - (n-1)- p : the null degrees of freedom less the number of parameters you are estimating in your model.
AIC – A model selection criterial that penalizes models having large numbers of predictors. AIC stands for Akiaike information criterion. It is defined as
AIC = n ln SSE p – n ln n + 2p
AUC – stands for Area Under Curve. The curve in question is the receiver operating characteristic curve. The criteria is a commonly used metric for evaluating the performance of classifier models. It gives the probability that a randomly chosen positive observation is correctly ranked greater than a randomly chosen negative observation. In machine learning, AUC is usually seen as the preferred evaluative criteria for a model (over accuracy) for classification models.
Confusion Matrix – in the even that you prefer accuracy to AUC as your evaluative criteria, the accuracy of the classifier can be evaluated from the confusion matrix, which reports actual versus predicted classifications, and the error rates of both.
Our model has an AUC of .81, which is not a bad days work (or more precisely, not a bad 1.5 minutes work, which is about how long it took the model to run on our server using a 15gig heap). Characterizing the songs from the nineties is now just a matter of taking the largest absolute value coefficients (both positive and negative) as the driving predictors. There are nearly 100 predictors, and the variables are largely uninterpretable (since they’re just acoustic attributes). Suffice it to say that the model predicts, and the method can be taken and applied to data of your very own.