- Activation Function
- Confusion Matrix
- Convolutional Neural Networks
- Forward Propagation
- Generative Adversarial Network
- Gradient Descent
- Linear Regression
- Logistic Regression
- Machine Learning Algorithms
- Multilayer Perceptron
- Naive Bayes
- Neural Networking and Deep Learning
- RuleFit
- Stack Ensemble
- Word2Vec
- XGBoost
A
C
D
G
M
N
R
S
X
- Activation Function
- Confusion Matrix
- Convolutional Neural Networks
- Forward Propagation
- Generative Adversarial Network
- Gradient Descent
- Linear Regression
- Logistic Regression
- Machine Learning Algorithms
- Multilayer Perceptron
- Naive Bayes
- Neural Networking and Deep Learning
- RuleFit
- Stack Ensemble
- Word2Vec
- XGBoost
Confusion Matrix
What is a Confusion Matrix?
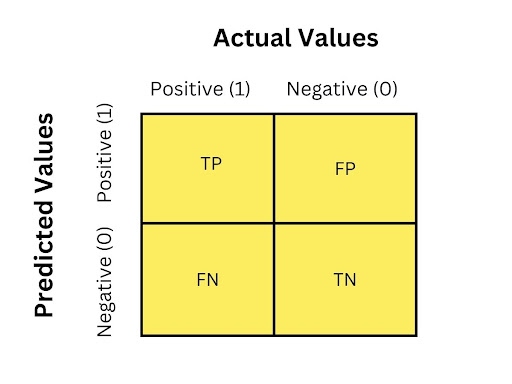
A confusion matrix is a table that evaluates the performance of a classification algorithm. The matrix uses target values to compare with machine learning (ML) predicted values. Each row in the matrix represents instances in a predicted class and each column represents instances in an actual class or vice versa.
An example of a confusion matrix is a binary classification algorithm that has two rows and two columns. The top left cell contains the number of true positives or instances that have been classified correctly as positives. The top right cell contains the number of false positives or instances that have been incorrectly classified as positive. The bottom left cell contains the number of false negatives or instances that have been incorrectly classified as negative. The bottom right cell contains the number of true negatives or the instances that have been correctly classified as negative.


Confusion Matrix Terms to Understand
Precision - The number of accurately predicted positive values is explained by precision. Or, put another way, it shows the number of correct outputs the model gave considering all the positive values it correctly predicted. It determines whether or not a model is trustworthy. It is beneficial in situations where the risk of a false positive is greater than that of a false negative.
Recall - The number of actual positive values that the model correctly predicted is referred to as recall.
Accuracy - The ratio of the number of correct predictions made by the classifier to the total number of predictions made by the classifiers is one of the significant parameters in determining the accuracy of the classification problems. It explains how frequently the model predicts the correct outputs.
F-Measure - When two models have low precision but high recall or vis versa, it is hard to compare them. To circumnavigate this, an F-score can be used. Both recall and precision can be evaluated simultaneously by calculating the F-score.
Null error rate - The null error rate indicates how frequently the model is incorrect in conditions where it always predicted the majority class.
Receiver Operating Characteristic (ROC) Curve - The classifier’s performance for all desirable thresholds can be seen in this graph. Additionally, a graph is drawn between the true positive and the false positive rate on the x-axis.
Area Under the Curve (AUC) - It measures a binary classification model’s unique potential. The likelihood that an actual positive value will be specified with a higher probability than an actual negative value increases when the value of the AUC is high.
Misclassification rate - Explains the error rate, or how often the mode gives wrong predictions. However, the ratio of the number of incorrect predictions to the total number of predictions made by the classifier can be used to calculate the error rate.
Cohen’s Kappa - This shows how well the classifier did in comparison to how well it would have done by chance on its own. In other words, a model will have a high Kappa score if the null error rate and accuracy are significantly different.
Benefits of Confusion Matrix
The following are ways a confusion matrix can be beneficial.
It details the classifier’s errors as well as the kinds of errors that are occurring.
It shows how predictions are made by a classification model that is disorganized and confused.
This feature helps overcome the drawbacks of relying solely on classification accuracy.
It is utilized in situations where one class dominates over others and the classification problem is profoundly imbalanced.
The recall, precision, specificity, accuracy, and AUC-ROC curve can all be calculated using the confusion matrix to great success.
Conclusion
A confusion matrix is an exceptional method for evaluating a classification model. Depending on the data that is fed into the model, precise insight is provided regarding if the classes have been correctly or incorrectly classified.


