

Unwrap Deep Neural Networks Using H2O Wave and Aletheia for Interpretability and Diagnostics
The use cases and the impact of machine learning can be observed clearly in almost every industry and in applications such as drug discovery and patient data analysis, fraud detection, customer engagement, and workflow optimization. The impact of leveraging AI is clear and understood by the business; however, AI systems are also seen as black box models. This leads to many users struggling to understand how or why decisions have been made. Hence, it is important to demystify the complex modeling techniques with comprehensive mathematics, detailed explanations, and practical tools, especially when used for real-world applications. Machine Learning Explainability is an area that focuses on making the models and their decisions transparent, clear, and interpretable by humans.
At H2O.ai, we work very closely with our customers and develop tools, frameworks, and best practices that provide outcomes that are actionable, predictive in nature, and most importantly, explainable to business. One such customer of H2O.ai is Wells Fargo, which is a leading multinational financial services company. Recently, the Corporate Model Risk team at Wells Fargo released a novel toolkit called ‘Aletheia’ and a paper to unwrap the black box models through local linear representation.
This technique utilizes the activation pattern and disentangles the complex network into an equivalent set of local linear models (LLMs). They developed a convenient LLM-based toolkit for interpretability, diagnostics, and simplification of a pre-trained deep ReLU network. With this technique, one can visualise the local linear models of a complex network and the effective merging strategy for network simplification. The final set of local linear models are simplified as compared to the original complex neural network. These models have almost equal performance as the original model, but they are highly explainable and transparent.
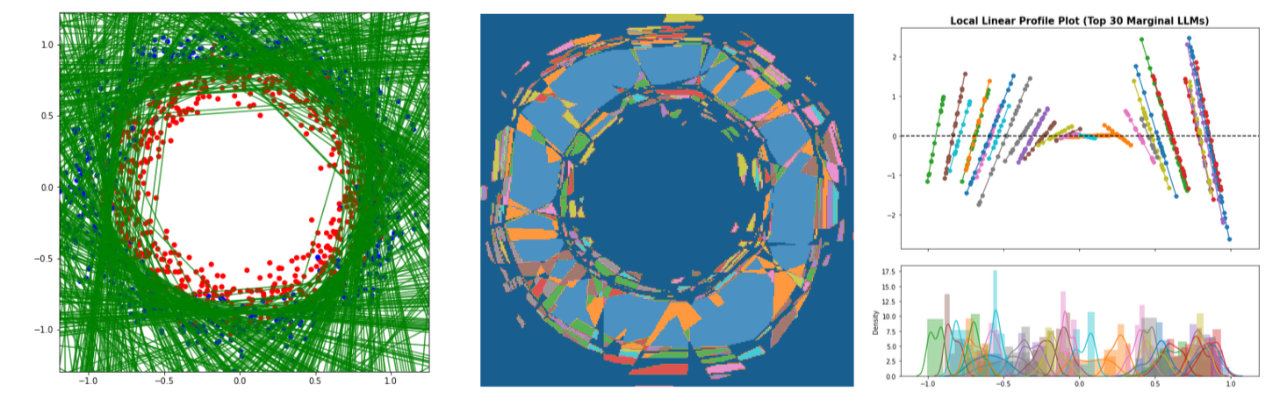
[Figure -1] Local linear models unwrapped from pre-trained ReLU net, the corresponding activation regions, and the local linear profile plot (Data: CoCircles; ReLU Net: [40]*4)
Following is the excerpt from the original paper:
- An unwrapper is developed to disentangle a pre-trained ReLU DNN into an equivalent set of local linear models (LLMs). Such unwrapper for both regression and classification problems is rigorously supported by local linear representation of ReLU DNNs based on the device of activation pattern and activation region.
- LLM-based interpretability is developed for deep ReLU networks, including local linear profile and joint importance of an individual feature, simultaneous interpretation of multiple LLMs through the parallel coordinate plot, and local interpretability by statistical inference.
- An effective merging algorithm is proposed for LLM-based network simplification. It combines the locally homogeneous LLMs with similar coefficients subject to local region connectivity. The single-instance or single-class regions are merged to nearest neighbor LLMs with large/medium sample sizes. Besides, an optional flattening strategy is proposed to further simplify the network.
One of the latest editions to H2O.ai tools is called H2O Wave, which is an open-source Python development framework that makes it fast and easy for users to develop real-time interactive AI apps with sophisticated visualizations. H2O Wave accelerates development with a wide variety of user-interface components and charts, including dashboard templates, dialogs, themes, widgets, and many more. Wave is a low code framework, which allows building applications with minimal python code – without any need for HTML, CSS, or JavaScript.
We leveraged H2O Wave to build a scalable application that allows users to upload their datasets, train a new deep neural network using H2O-3 and finally use the Aletheia toolkit for unwrapping the model in the sets of local linear models.
[Figure -2] Aletheia – H2O Wave Application: Selecting a dataset and training a new machine learning model
[Figure -3] Aletheia – H2O Wave Application: User parameters and the model configuration required for training
Once the model is trained in the app, Aletheia is used to unwrap and simplify the neural network model. As the last step, a dashboard is generated in the app showing plots and visuals associated with all the local linear models.
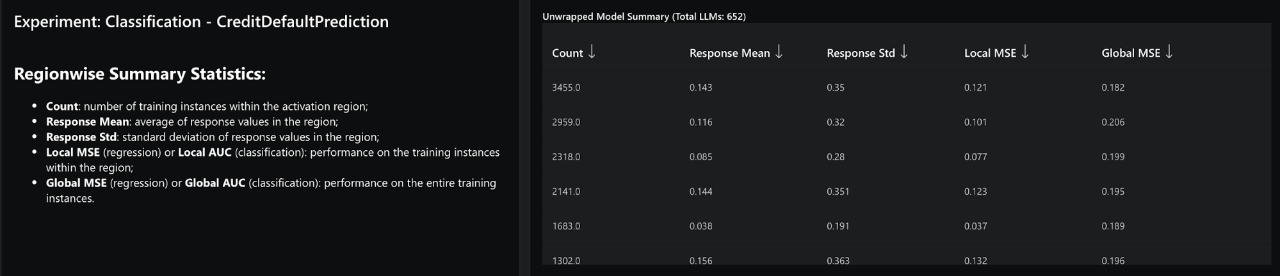
In the example shown in the figure, we trained a model on the Taiwan Credit Card dataset, and we can observe that there are about 650+ local linear models obtained from the dense neural network. The table in the below figure shows the summary statistics of each local linear model; the “count” column shows the number of data points used in building that region for the LLM.
[Figure -4] Aletheia – H2O Wave Application: User parameters and the model configuration required for training
The following section shows artifacts such as parallel coordinates to display the joint effects of the features. In this plot, one can observe the distribution of main effects from feature to feature and assess their effect consistency among multiple local linear models. In this plot, one can check if most of the coefficients are large and have the same sign; the feature is important for the final prediction. If the coefficients are small and close to zero, features are not important and can be excluded from the model.
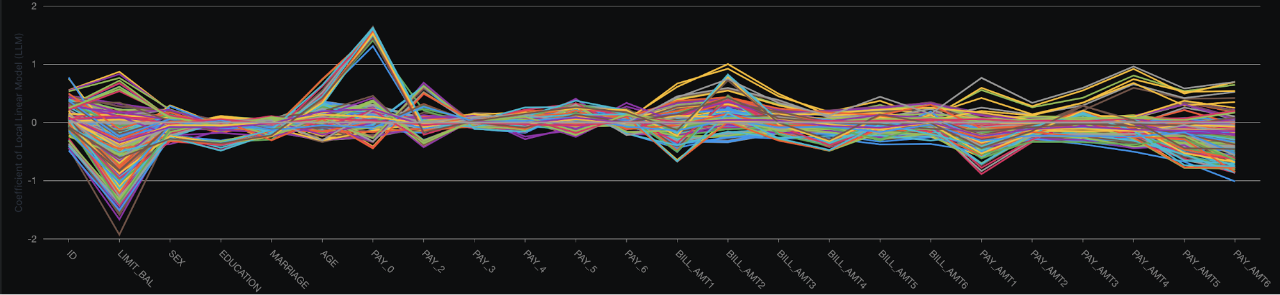
[Figure – 5] Aletheia – H2O Wave Application: Parallel Coordinate plot to show joint effects of features
The application then shows the profile plot for each feature and the associated density plot, which shows the nature of slopes, marginal effect, and density associated with different local linear models. The local linear models whose slopes are small and are mostly flat are not very important linear models.
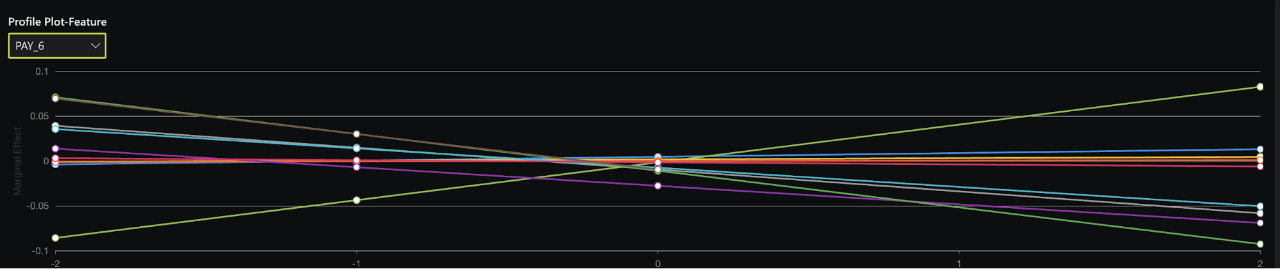
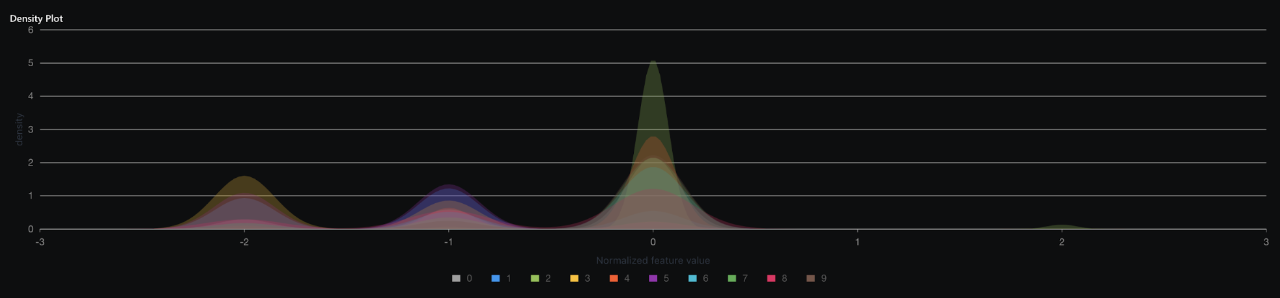
[Figure -6] Aletheia – H2O Wave Application: Profile and Density of each feature
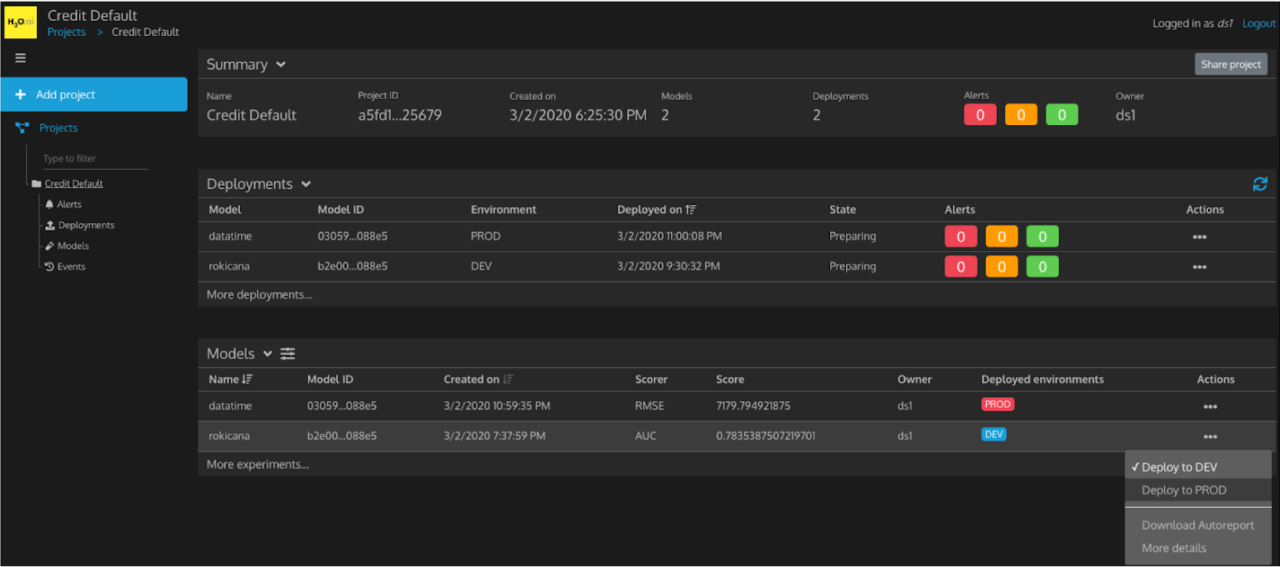
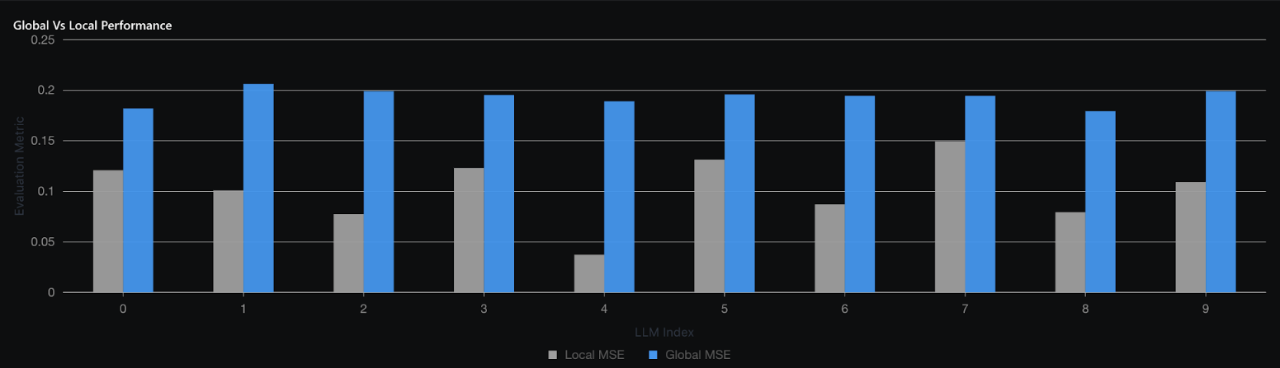
The unwrapper also enables to perform diagnostics on a pre-trained neural network based on the set of LLMs. In this case, the application checks each local linear model in terms of their local performance (in the corresponding region) and global performance) for the entire data.
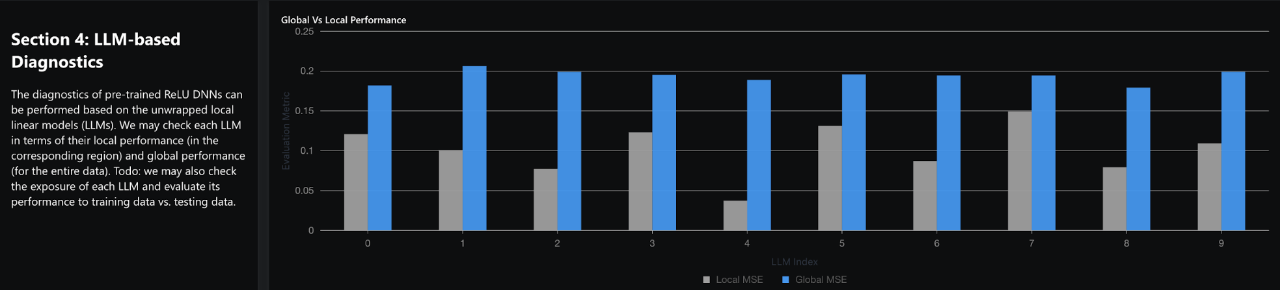
[Figure -7] Aletheia – H2O Wave Application: Global vs. Local Performance
Finally, the app lets users simplify their models by merging multiple local linear models. Aletheia provides this functionality in which Two LLMs can be merged as their corresponding regions are nearby with similar local linear coefficients and intercepts. The similarity between two LLMs is defined as the Euclidean distance between their local linear coefficients and intercepts, subject to the connectivity constraint. The simplified model shows a reduced number of local linear models; for instance, in the example used, 652 models have been reduced to only 8 local linear models, which are enough to make similar predictions as the original model. Users can also download the simplified model.
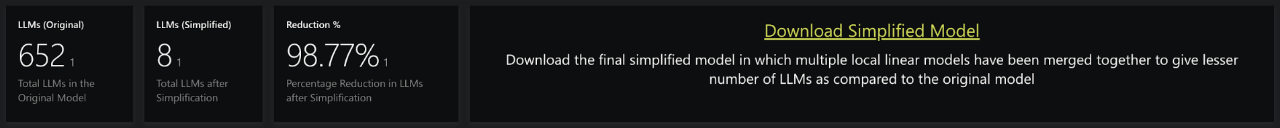
[Figure -8] Aletheia – H2O Wave Application: Download Simplified Model
How to build this type of app using H2O Wave
Let’s discuss how we leveraged H2O Wave to develop an App like this. First, we create the skeleton of the app, the root folder is called – MyAletheiaApp and create a python file inside it named app.py .
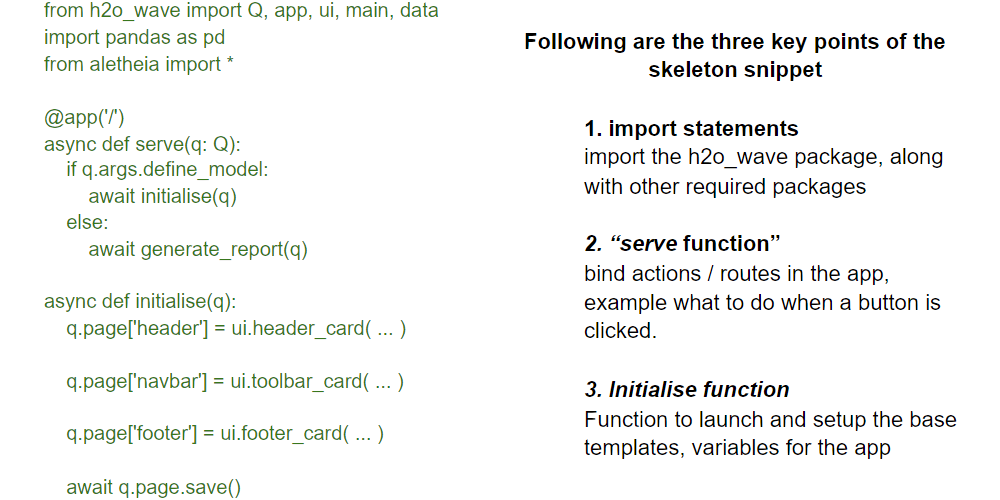
Let’s now look at how to create a page of the app with the following elements: Header Card, Footer Card, Navbar, Stepper, and Form.

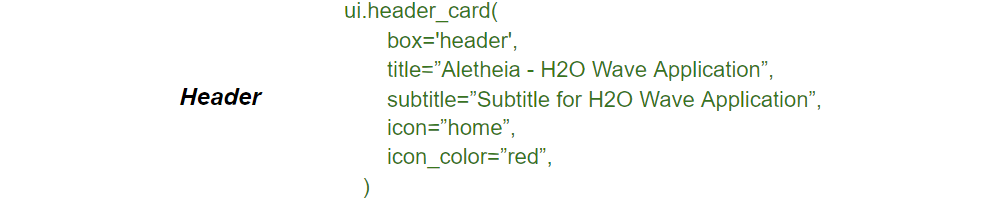
Wave SDK provides several ready to use code-templates and card components that can be used as-is in any new app. For example – ui.header_card can be used to create a header. We need to define “box” which defines the location of the header card. Similarly, title, subtitle, icon to display and its color can be defined to customize the header card according to the new app requirements.

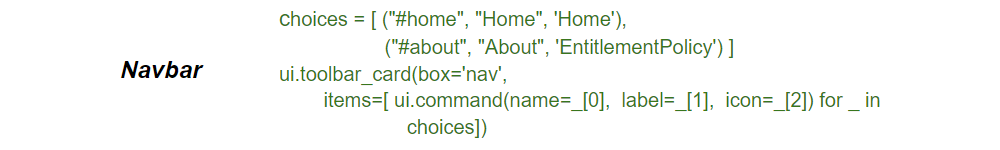
Using ui.toolbar_card we can create a toolbar which acts like a navigation bar to change the tags / content of the page. Users can provide the choices for the tab bar which can be used in the toolbar. The first parameter gives the route, name of the tab, and the Icon.
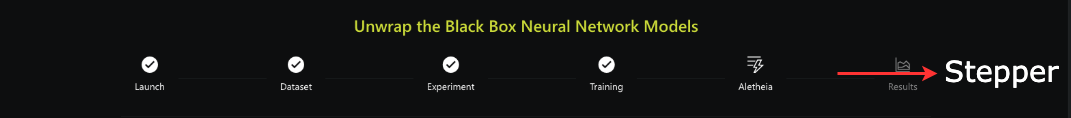
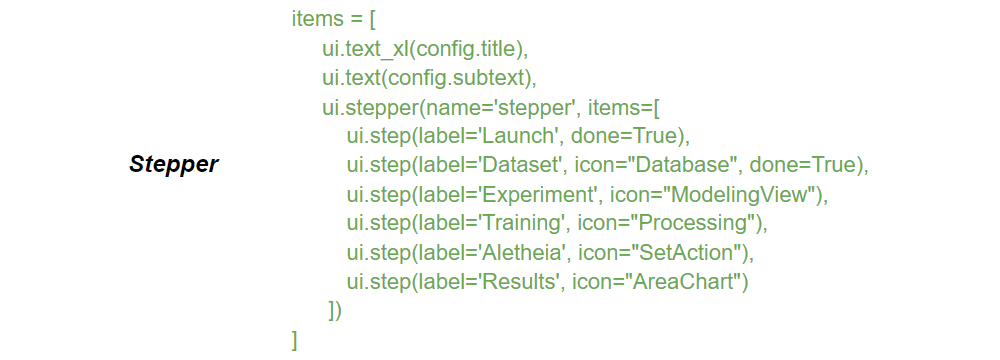
Stepper elements can be added to the same page, which can be used to show the progress.
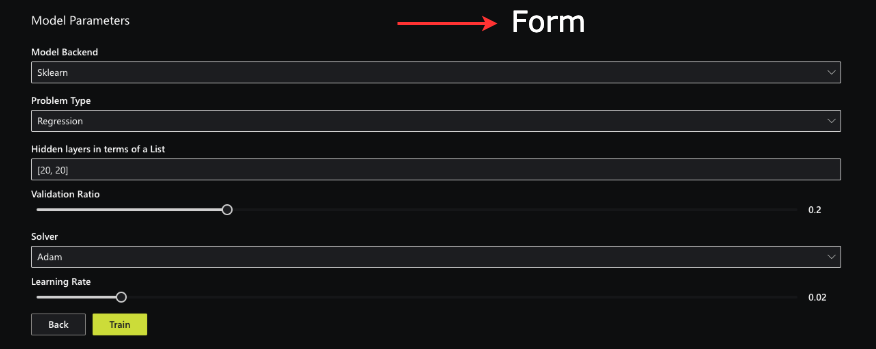
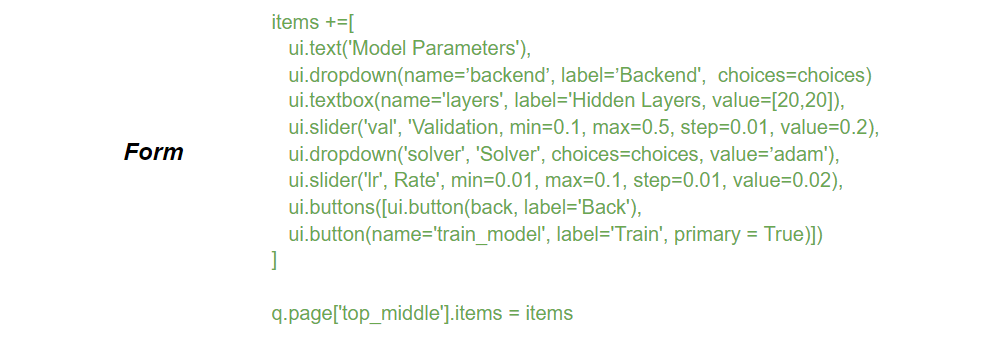
The form items can be extended to add elements such as dropdown, sliders, text boxes, and submit buttons.


Similar to header_card, h2o_wave ui provides footer_card to display the text in the page’s footer
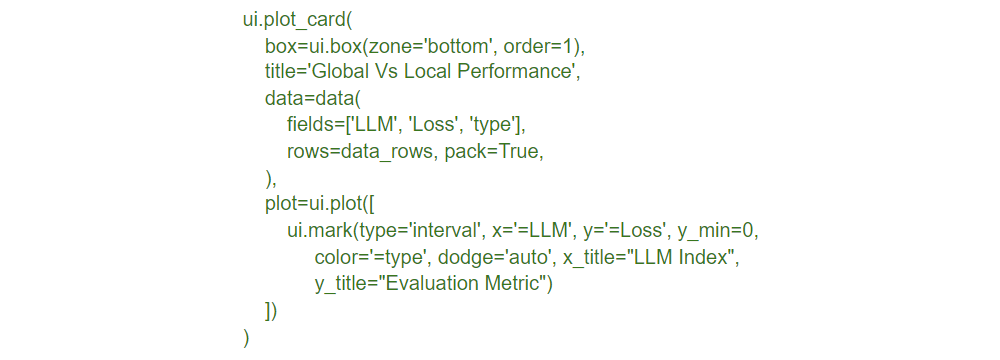
By using these components, one can rapidly develop beautiful nice web pages for your app. In the H2O-Wave Aletheia app, we have also added a number of visualizations. Wave provides native plotting capabilities to generate the visualizations that are meant to scale. The following example shows how we used ui.plot_card component to create a multi-bar chart. Assuming we have a data_rows element which is a list of triplets : (name, value, color), it can be passed to the plot_card element to generate the plot.
H2O Wave lets you build and deploy amazing, real-time analytics with dramatically less effort. H2O Wave gives your Python programs the ability to push content to connected clients as it happens in real-time. In other words, it lets your program display up-to-date information without asking your users to hit their browser’s reload button. Download H2O Wave now and start building similar applications.
How to get started
You can get hands-on experience with our demo Wave apps as well as H2O Driverless AI , our award-winning machine learning platform. Request a demo here.